


Our Elliott Wave analysis has identified several well-defined trading setups recently, including the SPY ETF setup discussed below. The analysis showed a three-wave correction developing from the recent peak, with price eventually approaching the Equal Legs area marked as our Blue Box buying zone.
This is the type of setup we closely monitor within our trading service. The Blue Box highlights a specific area where we look for a potential long entry, while the Elliott Wave structure provides a framework for managing risk and identifying potential targets.
In the following sections, we will break down the SPY setup and show how the opportunity developed.
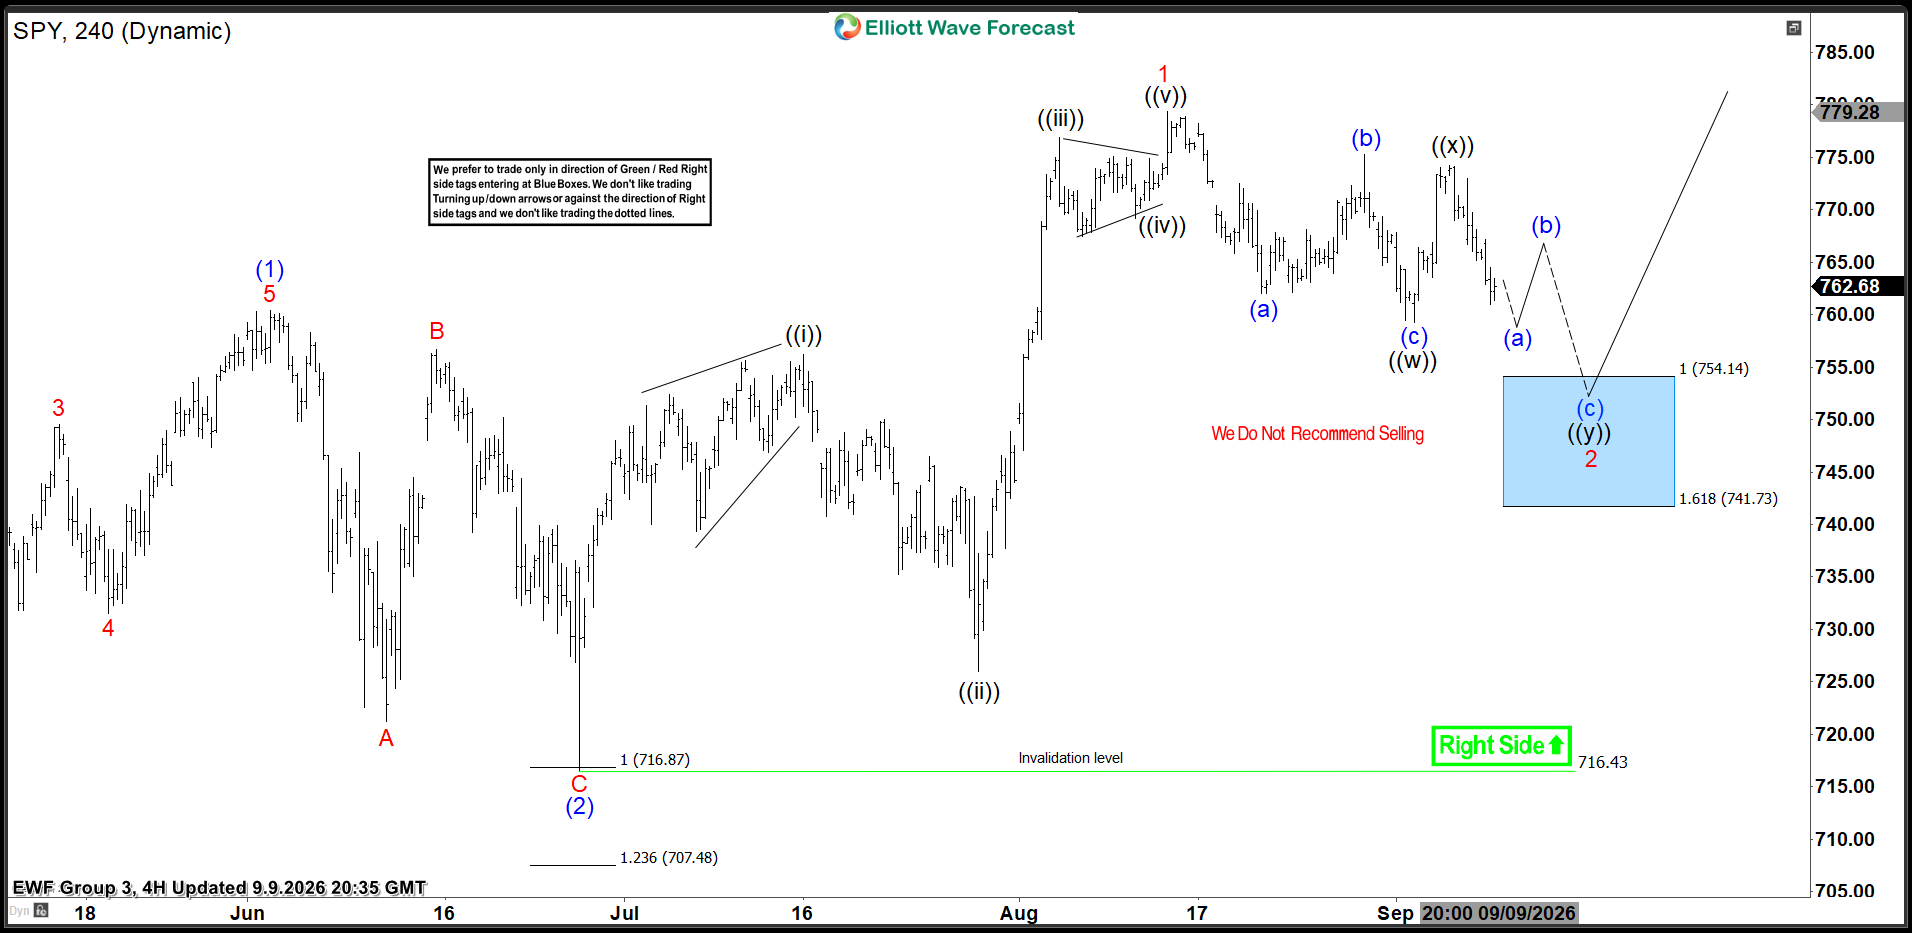
SPY Elliott Wave 4-Hour Chart – 09.09.2026
SPY is forming a three-wave pullback from the recent high, and the correction still appears to be incomplete. The current view suggests that only the first leg, wave ((w)), has been completed. We expect another leg lower toward the 754.14 -741.73 area.
At this stage, we are not looking to sell SPY. Instead, our focus remains on the long side. With the broader trend still bullish, we expect buyers to potentially step in around the marked Blue Box area. From there, SPY could develop at least a three-wave bounce, with the potential to extend higher and eventually challenge new highs.
A break below the 1.618 Fibonacci Extension at 741.73 would invalidate this setup.
This is the type of opportunity we monitor for our members: a clearly defined buying zone, a specific invalidation level, and a structured plan for managing the trade as price develops.
Rather than chasing the market or trying to predict every short-term move, our members can follow these setups as they unfold and use clearly defined levels to manage the trade.
The official trading strategy for identifying 3, 7, and 11 swings and Equal Legs setups is explained in detail in our educational video. The video is available exclusively to members inside the membership area.
How to Read Our Charts
Red bearish stamp + Blue Box = Selling setup
Green bullish stamp + Blue Box = Buying setup
Black stamp = No trade zone
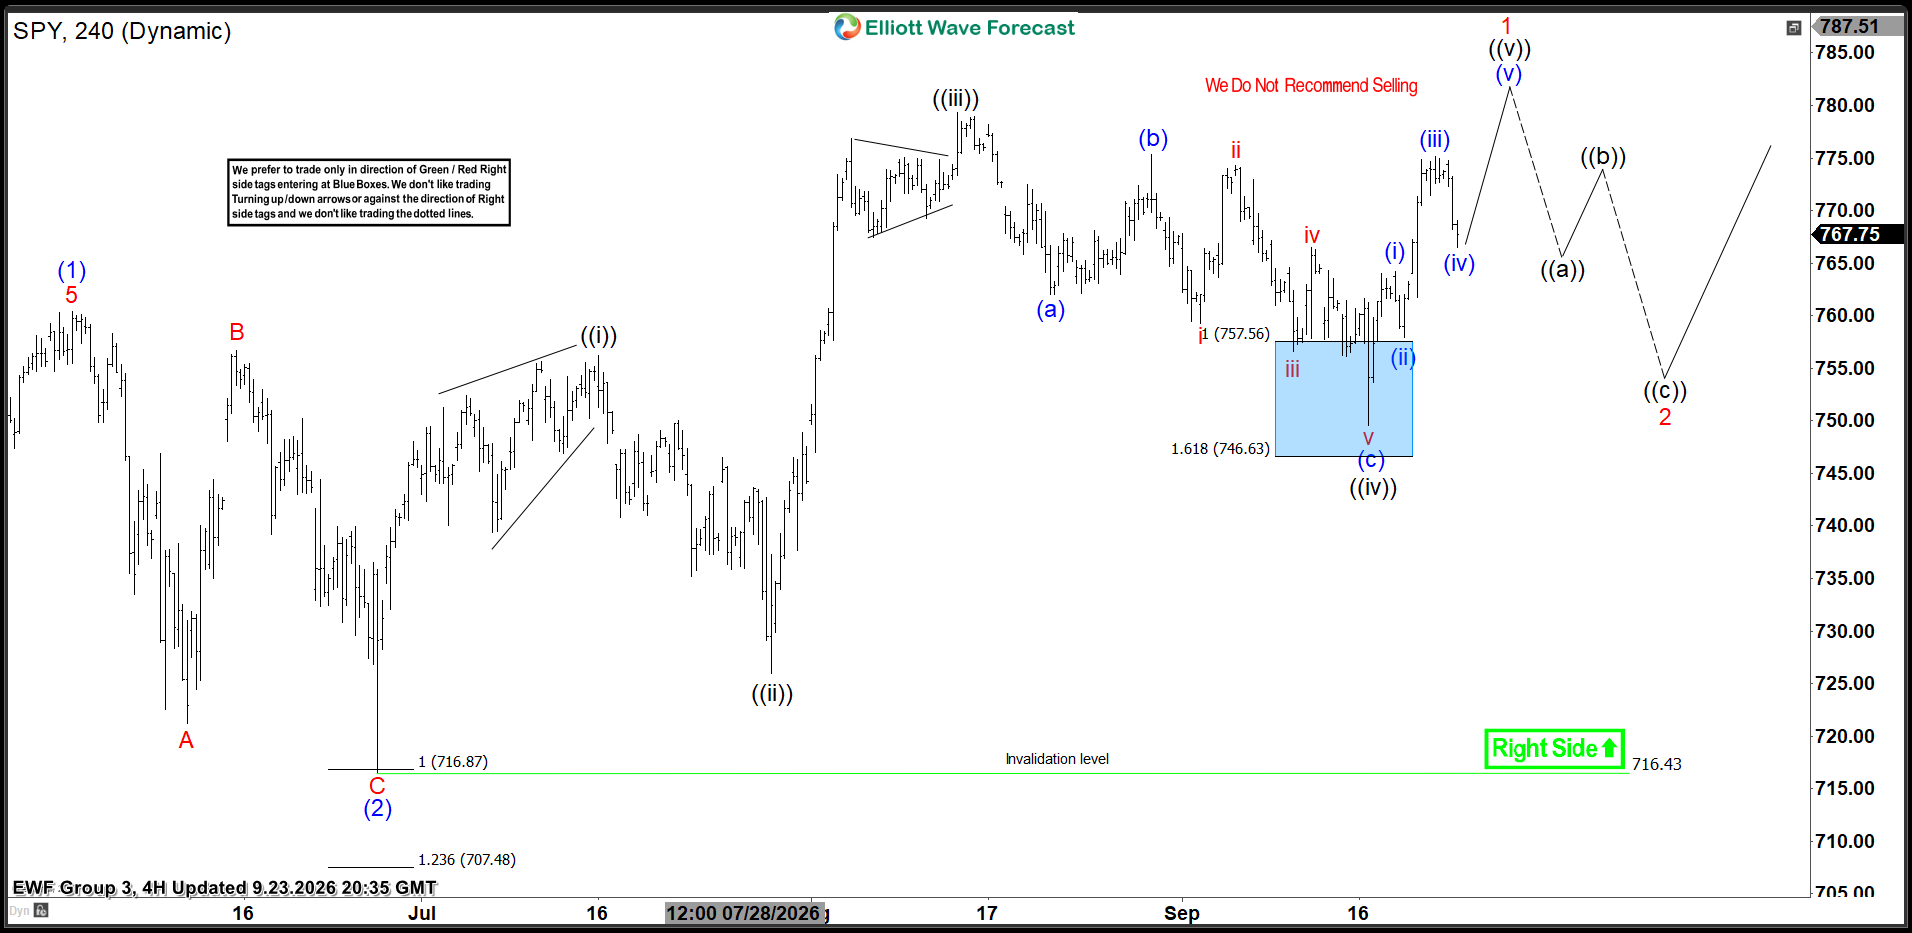
SPY Elliott Wave 4-Hour Chart – 09.23.2026
SPY reached the Blue Box buying area and buyers stepped in, triggering the expected recovery. The ETF has since posted a strong rebound, and we now consider the correction complete at the 749.70 low.
As long as this low holds, the current structure favors further upside, with SPY potentially pushing toward fresh highs. A break below 749.70, however, would suggest that the correction may not be finished. In that case, we would allow the structure to develop further before looking for the next setup.
Keep in mind that the market is dynamic, and the view presented here may have changed in the meantime. Follow our latest charts, trading setups, and target levels inside our membership area.
The best instruments to trade are those with incomplete bullish or bearish swings. These setups are highlighted in our Sequence Report, while the highest-conviction opportunities are presented in the Live Trading Room.



Comments
Log in or sign up to join the conversation.