

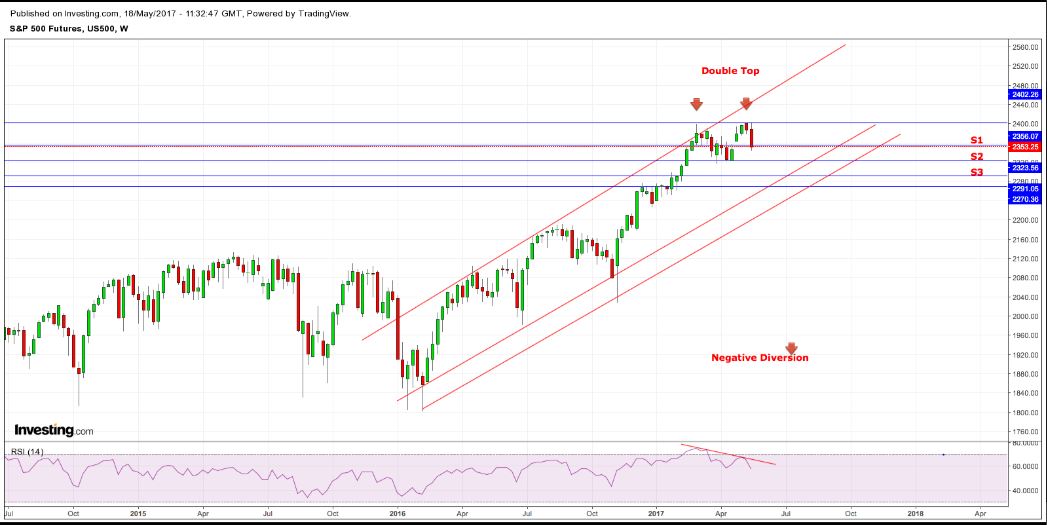
The bull run of the S&P 500 Index, which started way back in early 2016, seems to be weakening. The S&P 500 Index on weekly charts has made a "Double Top Pattern" or can be referred as "'M' Top Pattern". Oscillator RSI(14) has also made a lower high, confirming Bearish Divergence. (A bearish divergence occurs when prices keep making higher high and oscillator starts forming lower highs, indicating weakness in trend.)
If the S&P 500 index closes below 2350 this week, then the price can retest 2325 levels. Closing below the 2320 level will confirm the downtrend.
Time to remain cautious on equity investments.
(Click on image to enlarge)


Comments
Log in or sign up to join the conversation.