

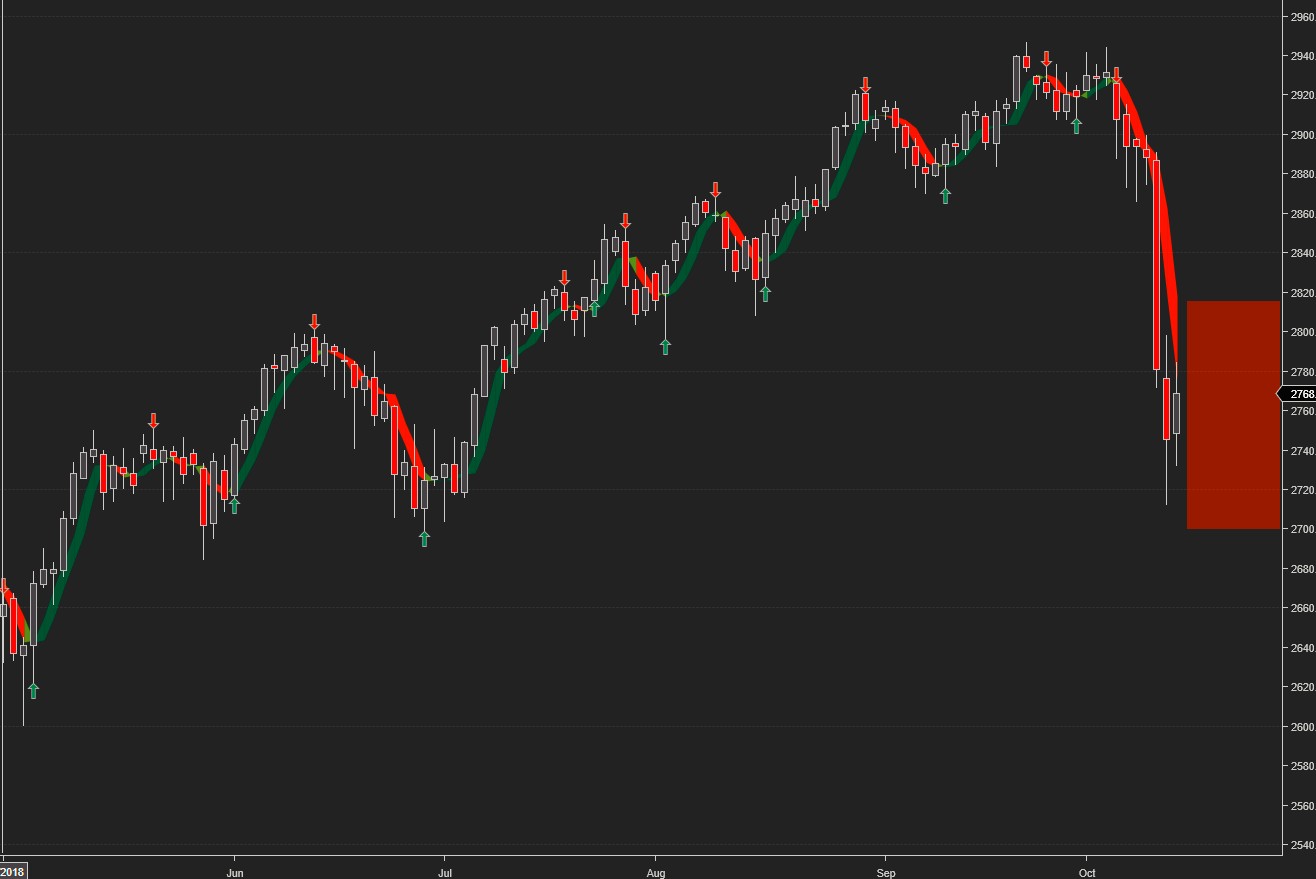
The decision to include current trading signals* in last week’s update proved to be very timely, as the SPX remained on a sell signal all week long and dropped 180+ points.
The SPX tested our weekly downside target from the beginning of the week, and finally broke below it on Wednesday. According to Hurst, a properly drawn channel should include about 80% of price extremes. From a practical point of view, in 20% of cases where there’s a sudden, sharp move and price breaks decisively outside of the channel, it will usually find resistance at the higher time frame channel/target. This proved to be the case, as the SPX found support exactly at the monthly downside channel/target.
Current SPX signals: Daily Sell, Weekly Sell, Monthly Sell
Monthly CIT pivot for SPX at 2916, S3 – 2735, R1 – 2953
The projected trading range for next week for SPX is 2700-2815:
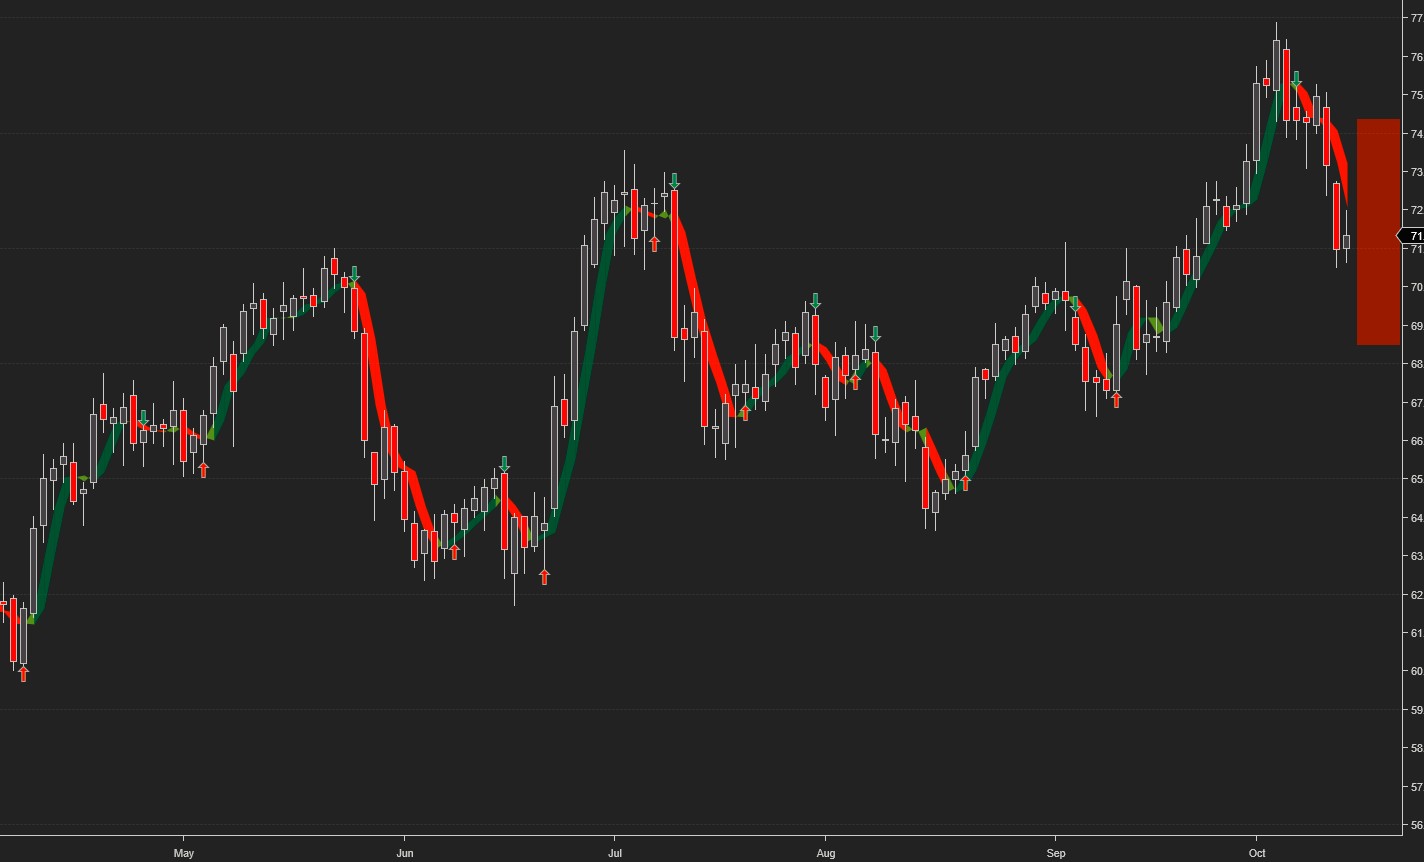
Oil switched from Hold to Sell on Wednesday and reached our weekly downside target.
Current signals: Daily Sell, Weekly Hold.
Monthly pivot for Oil at 73.3, S1 – 71, R1 – 76
The projected trading range for oil for next week is 69 – 74.5:
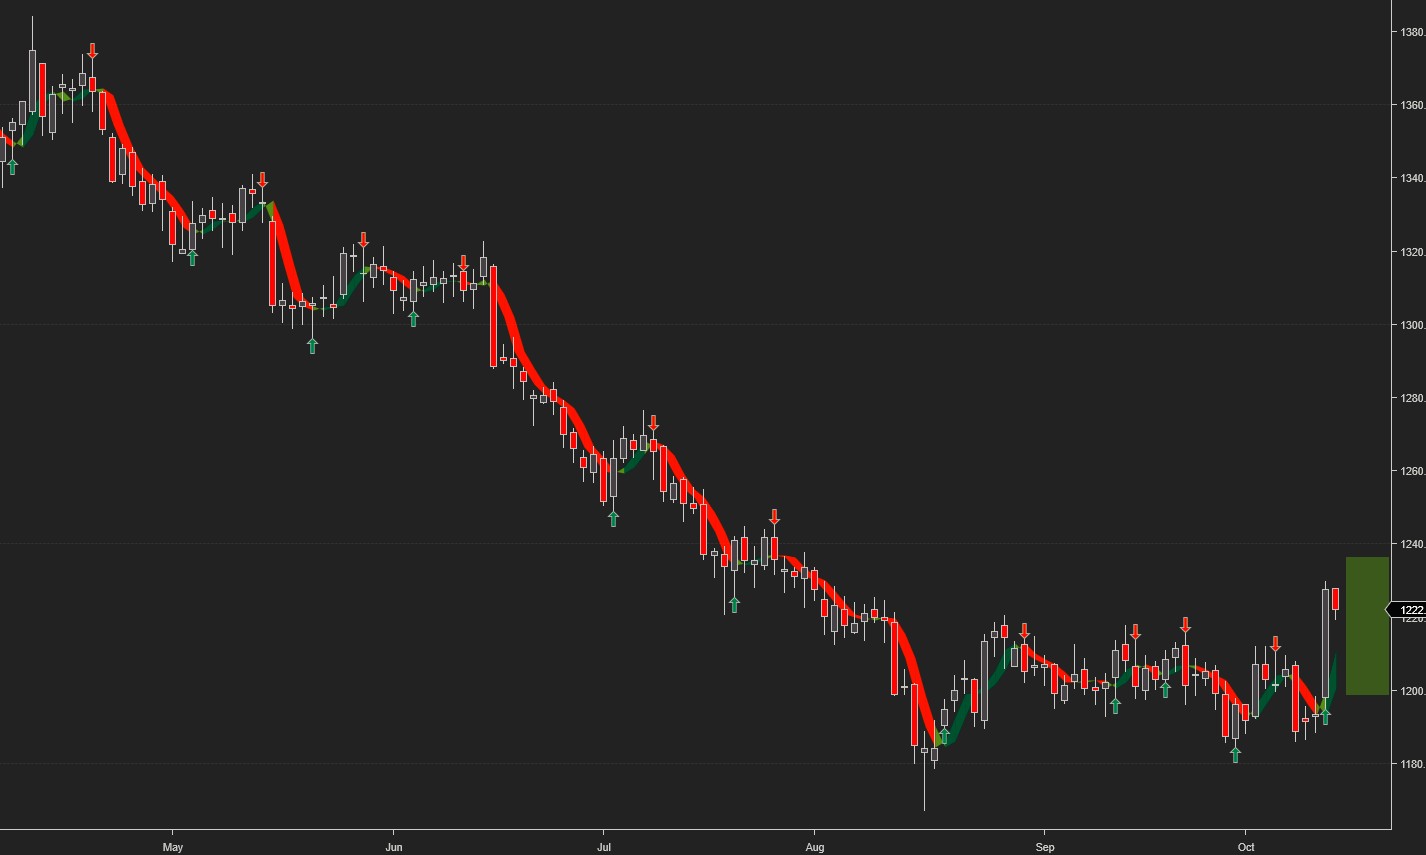
Gold reached our upside weekly target on Wednesday. It also broke above 1220 which we mentioned as an important precondition for a bullish reversal. Follow through will be critical for next week.
Current SAR signals: Daily Buy, Weekly Buy
Monthly pivot for Gold at 1196, S1 – 1172, R2 – 1240.
The projected trading range for gold for next week is 1200 – 1240:
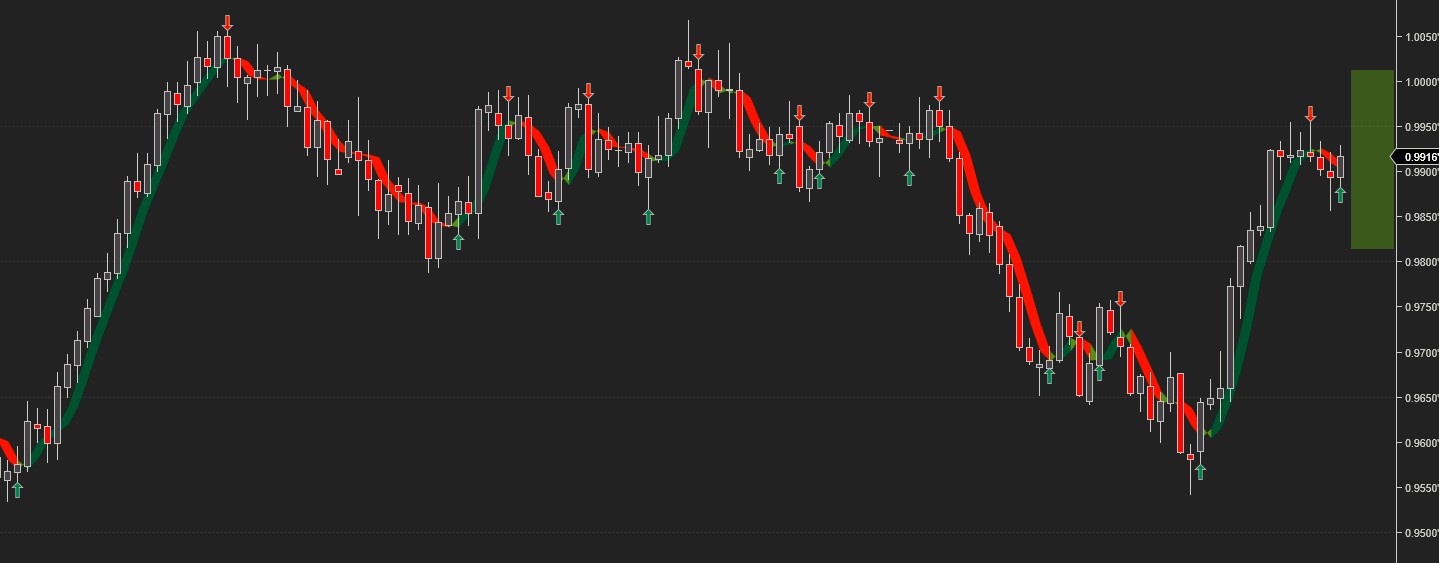
The G6 pairs, with the exception of USDCHF and AUDUSD, hit our targets.
USDCHF remained on a buy signal, but traded flat.
Current trading signals: Daily Buy, Weekly Buy
Monthly pivot for USDCHF at 0.981, S1 – 0.97, R1 – 0.993
The projected trading range for USDCHF for next week is 0.982 – 1.0:
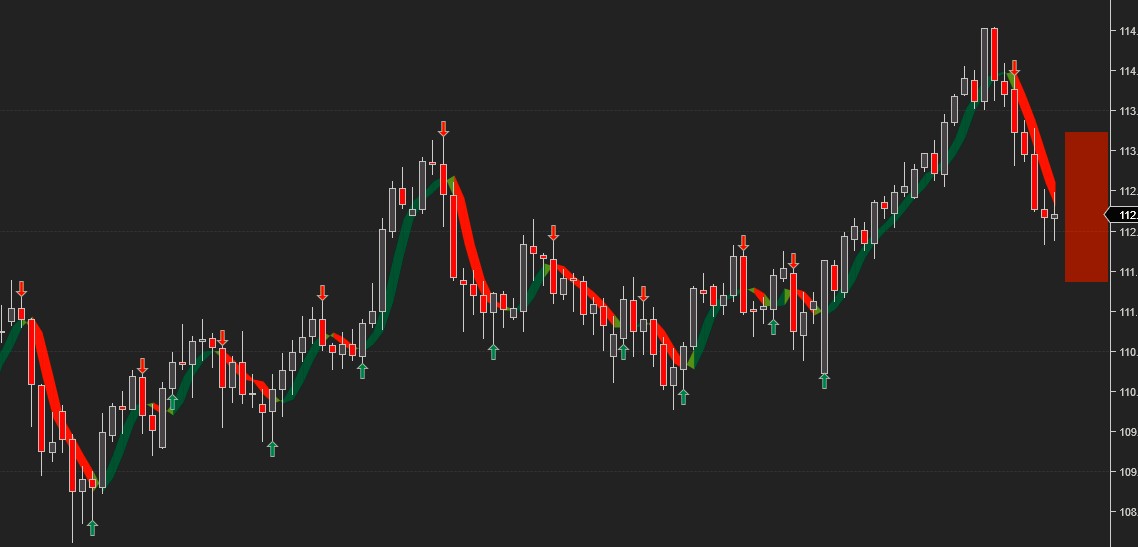
Last week we observed that the USDJPY daily upswing which began on 9/11 was pushing the limits of daily swing duration. USDJPY switched to a sell signal on Monday and broke below our weekly downside target on Wednesday.
Current trading signals: Daily Sell, Weekly Sell
Monthly pivot for USDJPY at 113.7, S2 – 111, R1 –115.
The projected trading range for USDJPY for next week is 111.5 – 113.2:
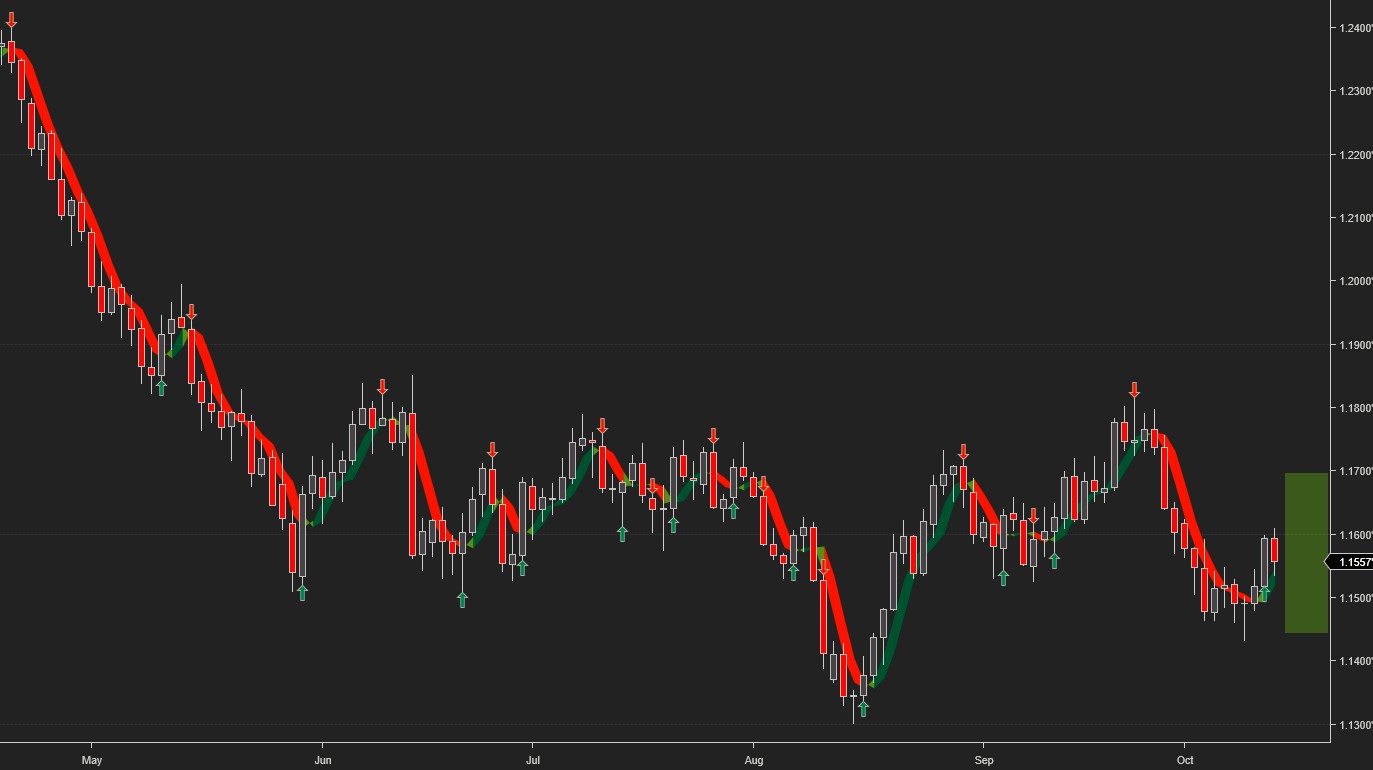
EURUSD transitioned from Sell to Hold to Buy and came within a few pips of our upside target. The Euro needs to break above 1.182 against the USD for any signs of a meaningful bullish reversal.
Current trading signals: Daily Buy, Weekly Sell/Hold
Monthly pivot for EURUSD at 1.1617, S1 – 1.147, R1 – 1.176
The projected trading range for EURUSD for next week is 1.145 – 1.17:
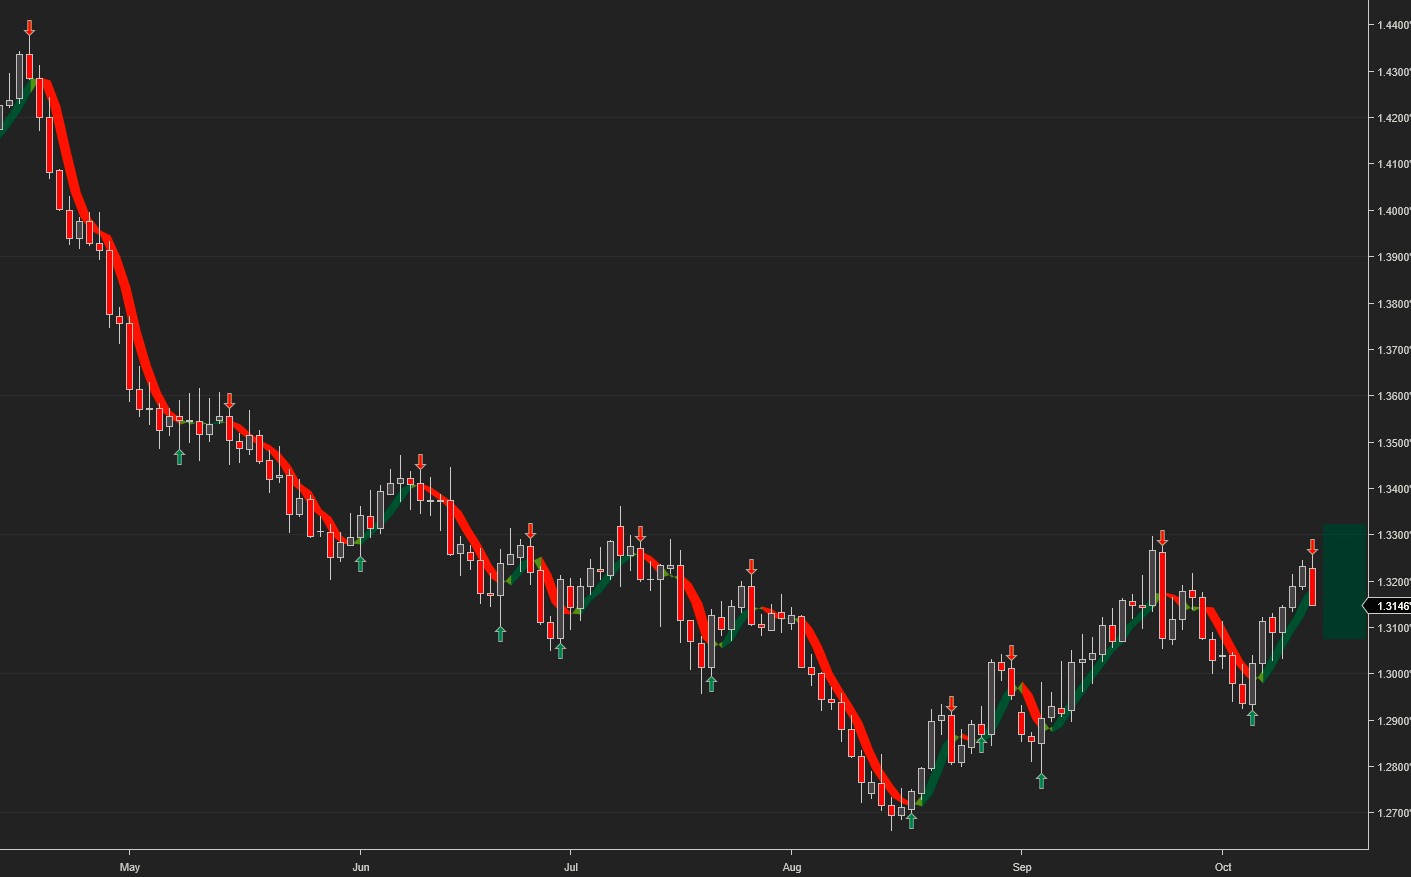
GBPUSD remained on a Buy signal until it reached our upside weekly target. On Friday, however, it reversed and close below the target, initiating a sell signal.
Current trading signals: Daily Sell, Weekly Buy
The monthly pivot line is at 1.302, S1 – 1.286, R2 – 1.338.
The projected trading range for GBPUSD for next week is 1.306 – 1.33:
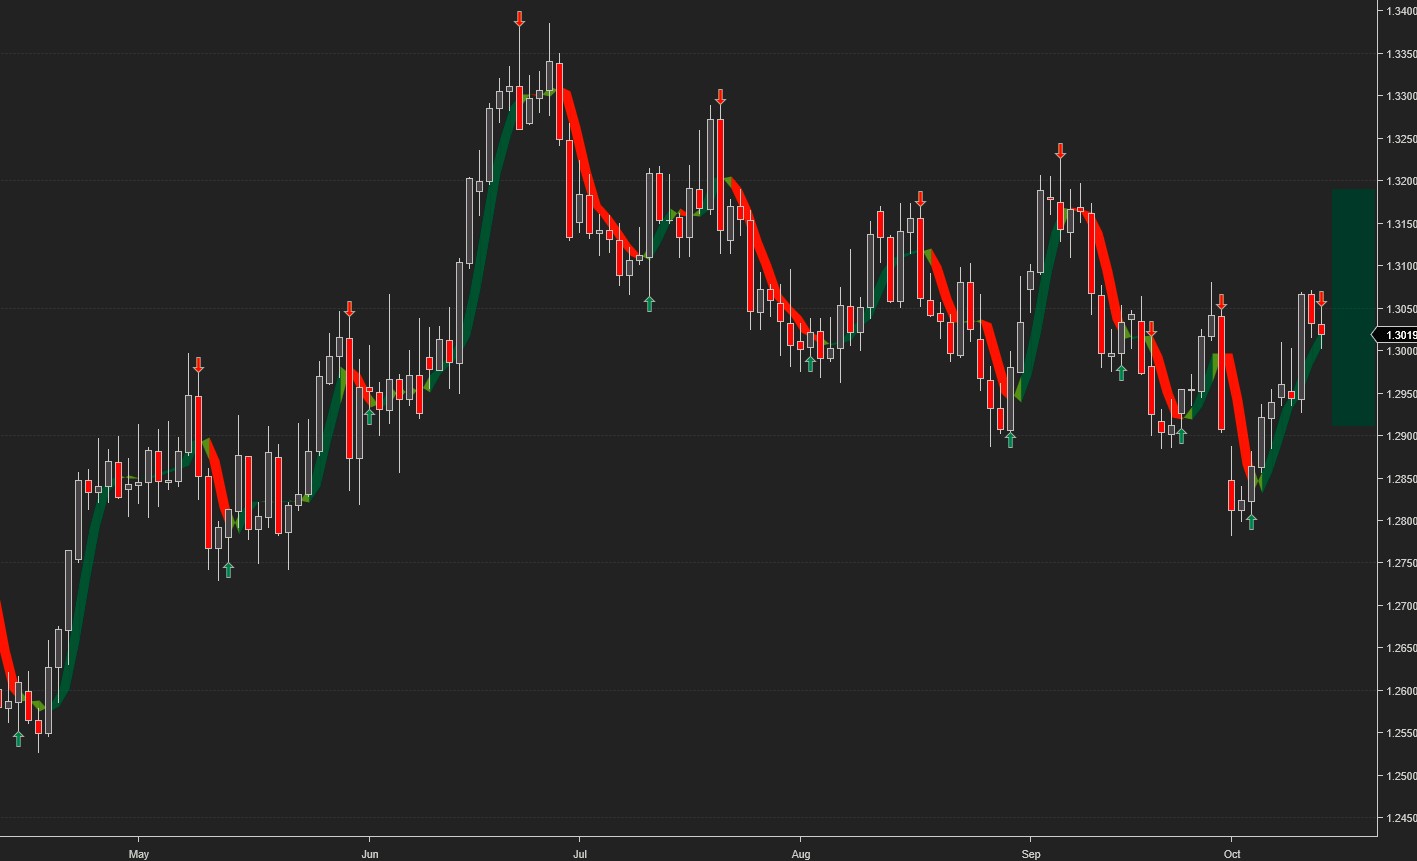
USDCAD remained on a Buy signal until it reached our upside target on Wednesday. Just like GBPUSD it reversed at the end of the week, triggering a sell signal.
Current trading signals: Daily Sell, Weekly Buy
Monthly pivot at 1.284, S1 – 1.27, R2 – 1.31
The projected trading range for USDCAD for next week is 1.29 – 1.32:
AUDUSD remained on a daily sell signal until Wednesday, but couldn’t reach our weekly downside target and seems ready for another counter-trend upswing.
Current trading signals: Daily Buy/Hold, Weekly Sell
Monthly pivot line at 0.722, S2 – 0.702, R1 – 0.733
The projected trading range for AUDUSD for next week is 0.7 – 0.72:
*Please note that the trading signals are in effect as of the close on Friday and may change as soon as the markets re-open. They are either marked with green/red arrows, or color coded as green/buy, red/sell and yellow/hold. When the current signal is hold, we also include the preceding buy or sell signal (e.g. Buy/Hold or Sell/Hold). Hold signals followed by a buy/sell signal in the direction of the preceding buy/sell signal can be considered for pyramiding the position.
Charts, signals and data courtesy of OddsTrader, CIT for TradingView and NinjaTrader 8

Comments
Log in or sign up to join the conversation.