


In this technical blog, we’ll take a closer look at the latest SPX Elliott Wave analysis published in our members area.
SPX completed a clear three-wave decline from the peak and reached our predefined Equal Legs buying zone. Buyers reacted exactly where we expected, triggering a strong rally that has since taken SPX to new all-time highs. This is the type of setup we look for every day: identify the structure, define the high-probability reversal area, manage the risk, and let the market confirm the idea.
Let’s take a look at the latest setup and what the Elliott Wave structure suggests next.
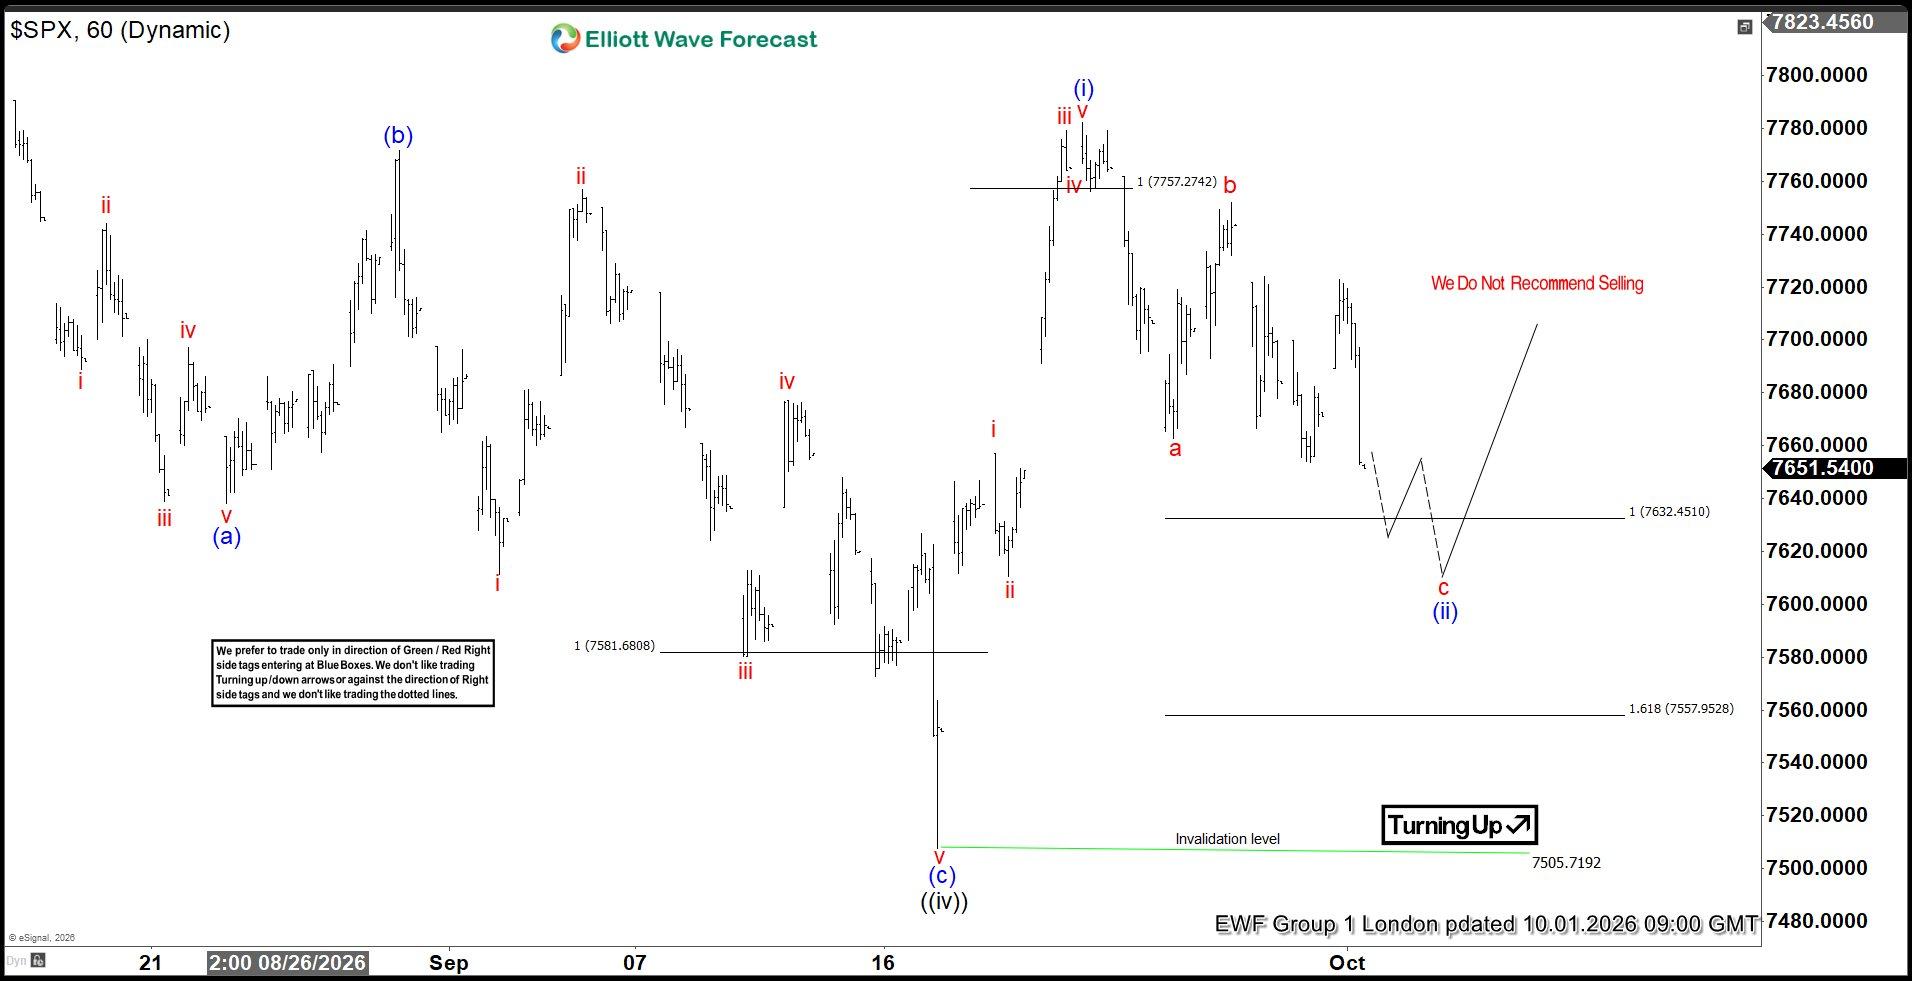
SPX Elliott Wave 1-Hour Chart – 10.01.2026
SPX is currently forming a three-wave pullback from the recent highs. The structure still appears incomplete, suggesting that the index may have further downside before the correction is fully completed. Using the Fibonacci Expansion tool in relation to waves A and B, we have identified a high-probability reversal area at 7362.45–7557.95.
We will be watching this zone closely for the next potential buying opportunity. If price reaches the area and buyers step in, the Elliott Wave structure suggests the potential for another strong rally, with new all-time highs once again in sight.
This is where having a clear market roadmap can make a real difference. Rather than chasing price after a major move has already happened, our members can prepare for the next opportunity in advance, identify the key levels, define the potential risk, and understand what price action would confirm or invalidate the setup.
Official trading strategy on How to trade 3, 7, or 11 swing and equal leg is explained in details in Educational Video, available for members viewing inside the membership area.
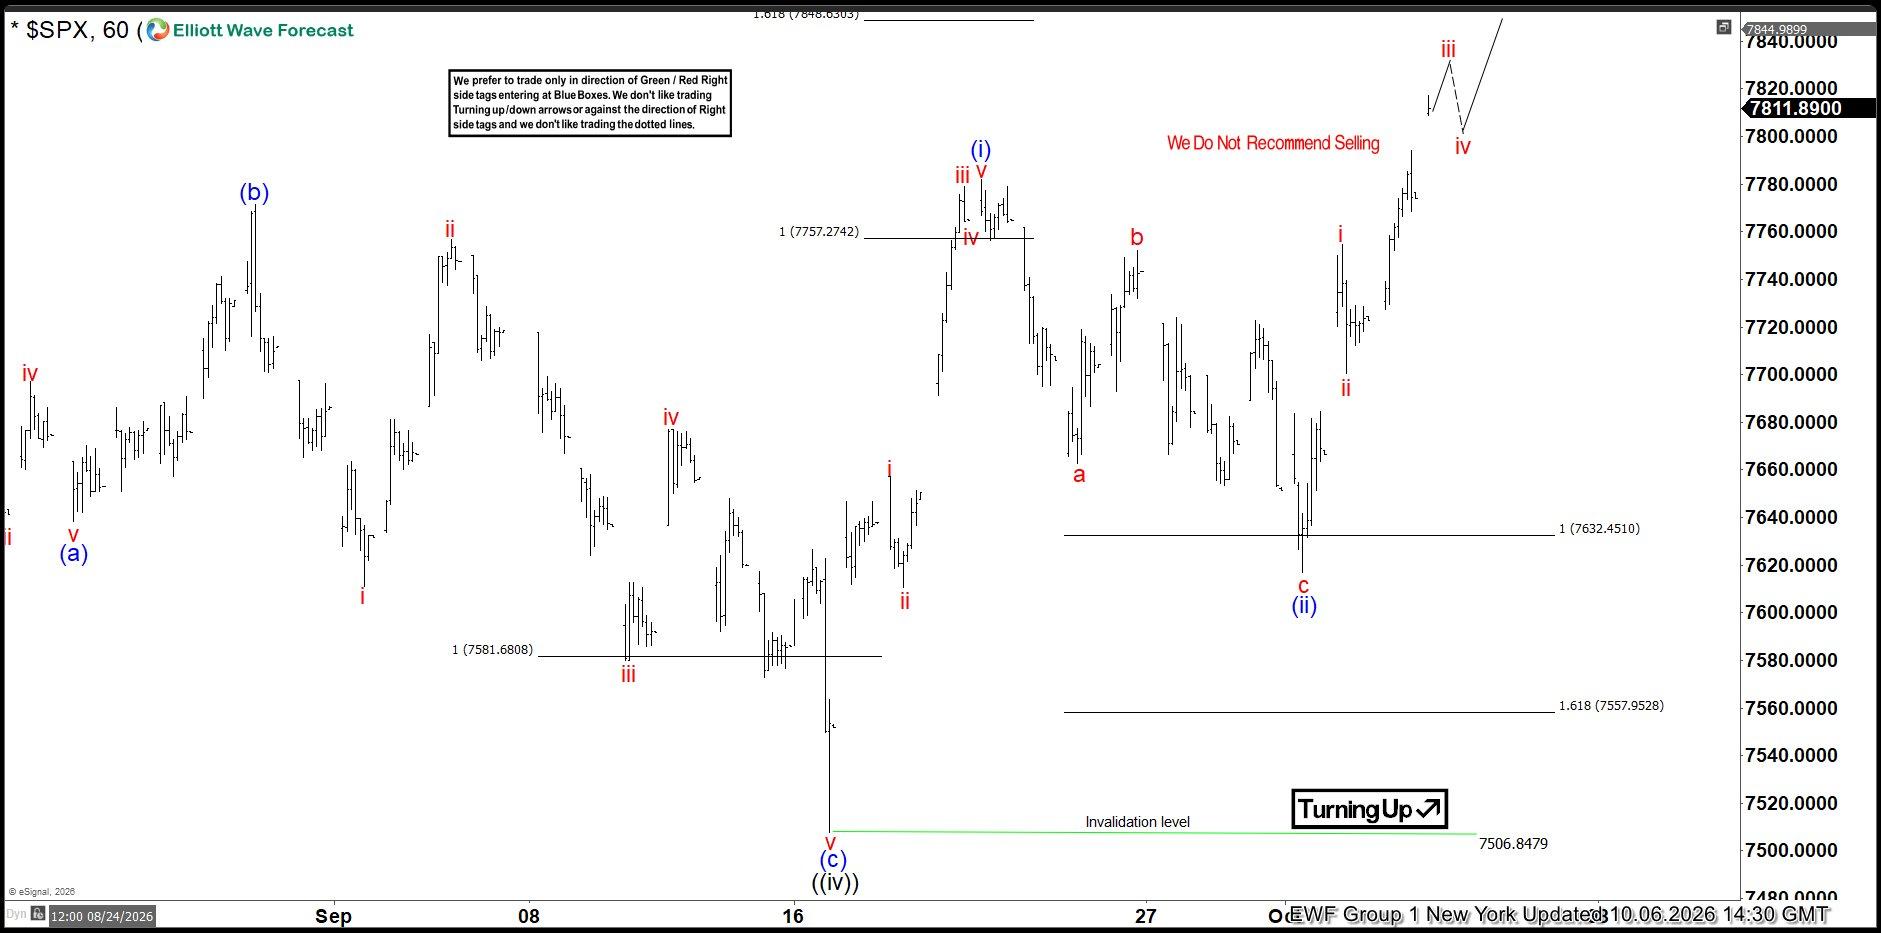
SPX Elliott Wave 1 Hour Chart 10.06.2026
SPX declined as expected, reached our Equal Legs buying zone, and found strong buying interest right at the level. The reaction led to a rally, with the index eventually breaking to new all-time highs and confirming the bullish sequence we had identified in advance.
Important note: Our analysis is not based on Elliott Wave in isolation. We perform detailed higher-time-frame cycle analysis, which shows an incomplete market structure. This is one of the key drivers of price action, along with correlation analysis and broader market context.
We also teach our members in live analysis sessions how to identify incomplete bullish and bearish sequences. Even a 14-day trial, is enough to noticeably improve your trading analysis and forecasting approach.



Comments
Log in or sign up to join the conversation.