

Most of the markets we follow hit their targets and the SPX made a new high, as expected.
The SPX advanced into the end of month then sold off, but with a little help from the jobs report on Friday, still managed to finish the week above the October 2018 highs. This slow grind higher keeps the momentum going, while at the same time transitions the SPX to a more sustainable advance trajectory.
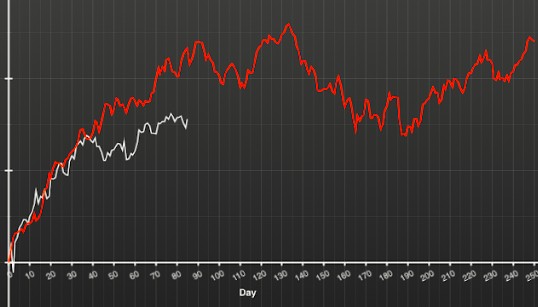
With a third of the year behind us, it is helpful to examine past cycles and look for guidance going forward. The model with the strongest correlation so far is presented below, and shows one possible outcome. (Chart courtesy of OT Seasonal)
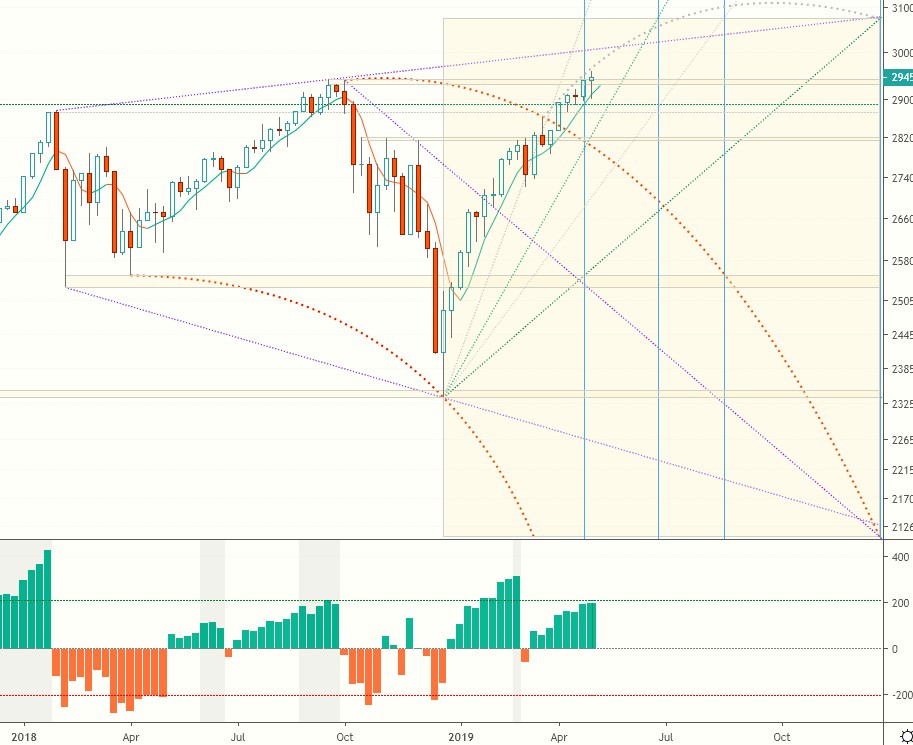
With the current upswing entering its ninth week, we’ll be keeping a close eye on any signs of price reversal or market breadth exhaustion. The price targets remain the same, and the short-term bearish line in the sand is at 2875.
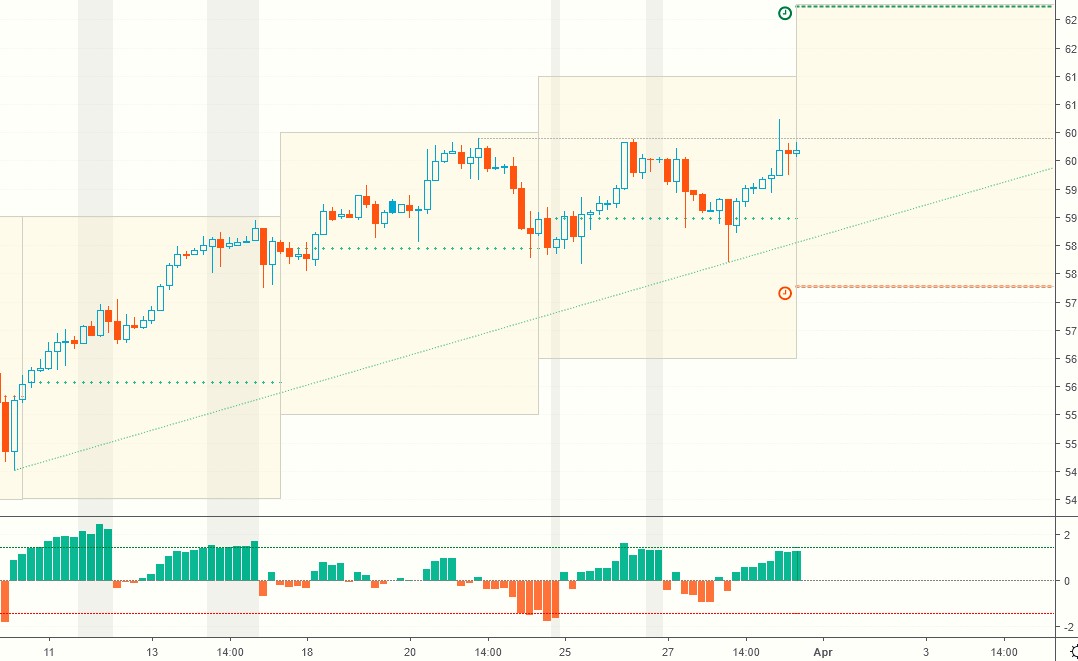
Current signals*: Daily Long, Weekly Long
For Weekly Buy/Sell pivots, intraday charts and target alerts check the TV page which gets updated in real time.
The projected trading range for next week for SPX is 2875-2975.
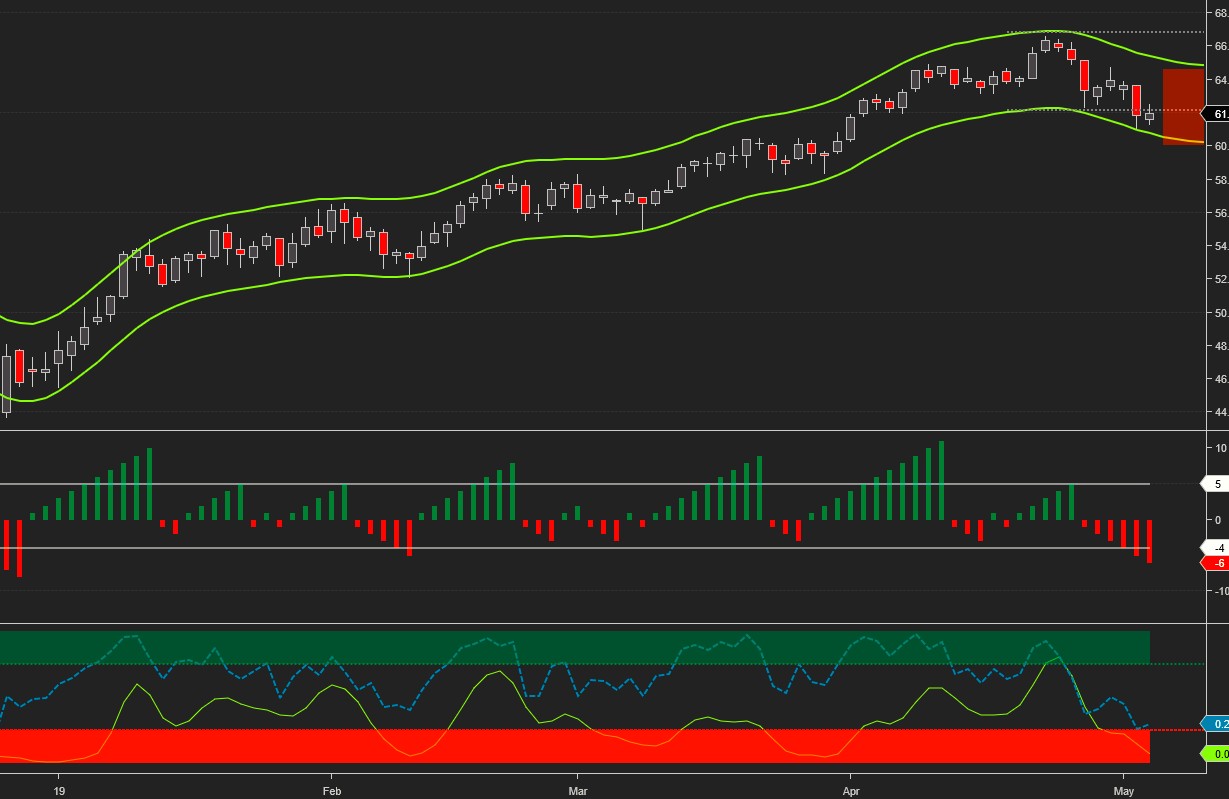
Oil continued sliding lower and reached our downside weekly target. It closed on Friday just below the key technical support/resistance level at $62.
Current signals: Daily Short, Weekly Short.
The projected trading range for Oil for next week is 60 – 65:
GOLD remains on a head-and-shoulders pattern watch. It is behaving in a classic TA fashion and is currently testing the neckline at 1288, which acted as support for the last four months. Failure at this level projects a long-term downside target of 1210.
The projected trading range for Gold for next week is: 1260 – 1300:
Due to technical issues we have to cut this article short. For the rest of the charts, please visit our TradingView page.
*Please note that the signals are provided for informational purposes only. They are in effect as of the close on Friday and may change as soon as the markets re-open.
Charts, signals and data courtesy of OddsTrader, CIT for TradingView and NinjaTrader 8
For intraday charts, target alerts and updates follow us on TradingView
Unfortunately, due to technical difficulties, we'll be cutting this article shorter than usual today.

Comments
Log in or sign up to join the conversation.