
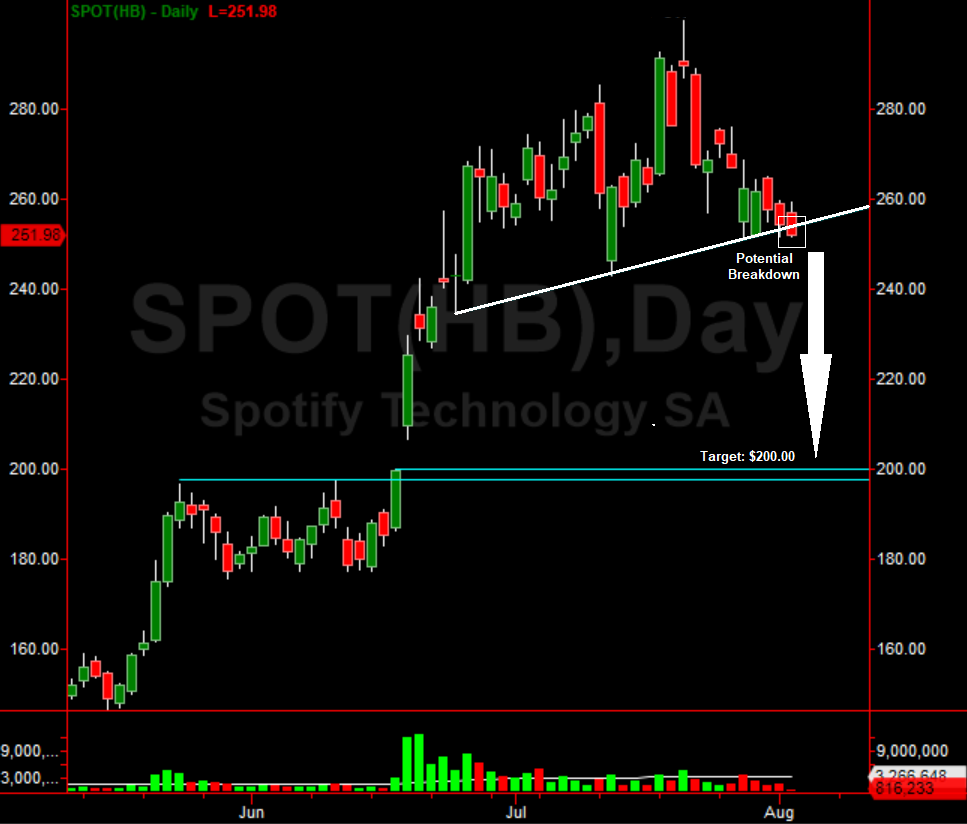
Spotify Technologies (SPOT) has been a hot stock over the last three months. A breakout above $200 took it as high as $300 before it has faded back near $250.00. Spotify chart analysis signals a potential major next leg lower today.
The stock price is hammering on a key support trend line at $253.00. Any close below that triggers a breakdown. There is no major support until it falls back to $200.00. The Spotify chart analysis is clear, look for a close below $253.00. If it happens, expect further downside in the coming weeks.
(Click on image to enlarge)


Comments
Log in or sign up to join the conversation.