

With today's release of the February S&P/Case-Shiller Home Price Index, we learned that seasonally adjusted home prices for the benchmark 20-city index were up 0.20% month over month. The seasonally adjusted national index year-over-year change has hovered between 4.2% and 6.7% for the last two-plus years. Today's S&P/Case-Shiller National Home Price Index (nominal) reached another new high.
(Click on image to enlarge)
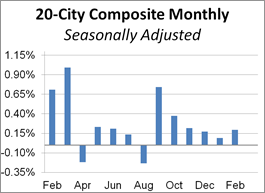
The adjacent column chart illustrates the month-over-month change in the seasonally adjusted 20-city index, which tends to be the most closely watched of the Case-Shiller series. It was up 0.20% from the previous month. The nonseasonally adjusted index was up 4.0% year-over-year.
Investing.com had forecast a 0.2% MoM seasonally adjusted increase and 3.7% YoY nonseasonally adjusted for the 20-city series.
Here is an excerpt from the analysis in today's Standard & Poor's press release.
“The pace of increases for home prices continues to slow,” says David M. Blitzer, Managing Director and Chairman of the Index Committee at S&P Dow Jones Indices. “Homes began their climb in 2012 and accelerated until late 2013 when annual increases reached double digits. Subsequently, increases slowed until now when the National Index is up 4% in the last 12 months. Sales of existing single family homes have recovered since 2010 and reached their peak one year ago in February 2018. Home sales drifted down over the last year except for a one-month pop in February 2019. Sales of new homes, housing starts, and residential investment had similar weak trajectories over the last year. Mortgage rates are down one-half to three-quarters of a percentage point since late 2018."
“The largest year-over-year price increase is 9.7% in Las Vegas; last year, the largest gain was 12.7% in Seattle. Regional patterns are shifting. The three California cities of Los Angeles, San Francisco and San Diego have the three slowest price increases over the last year. Chicago, New York and Cleveland saw only slightly larger prices increases than California. Prices generally rose faster in inland cities than on either the coasts or the Great Lakes. Aside from Las Vegas, Phoenix, and Tampa, which saw the fastest gains, Atlanta, Denver, and Minneapolis all saw prices rise more than 4% -- twice the rate of inflation.” [Link to source]
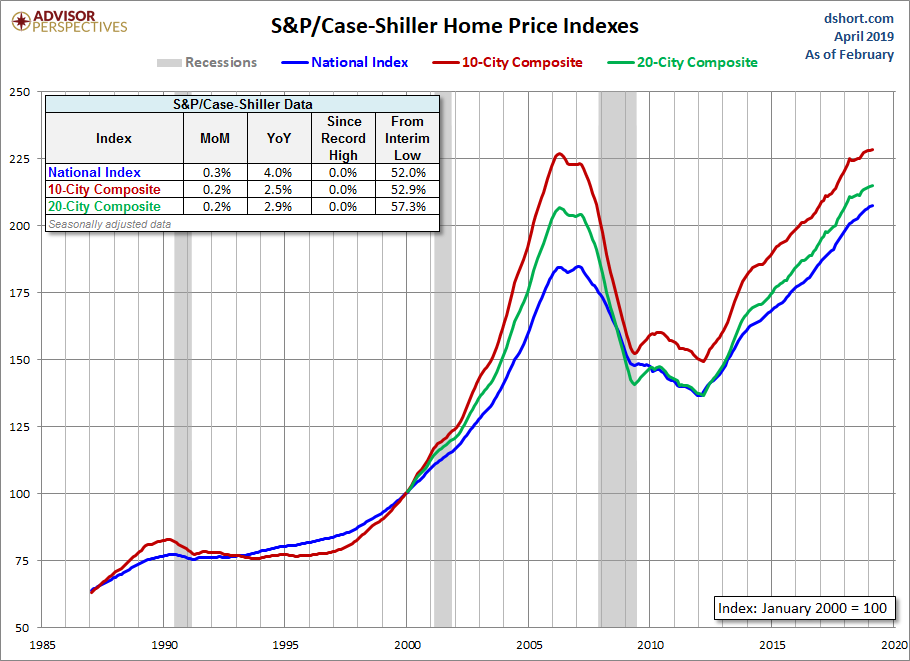
The chart below is an overlay of the Case-Shiller 10- and 20-City Composite Indexes along with the national index since 1987, the first year that the 10-City Composite was tracked. Note that the 20-City, which is probably the most closely watched of the three, dates from 2000. We've used the seasonally adjusted data for this illustration.
(Click on image to enlarge)
(Click on image to enlarge)
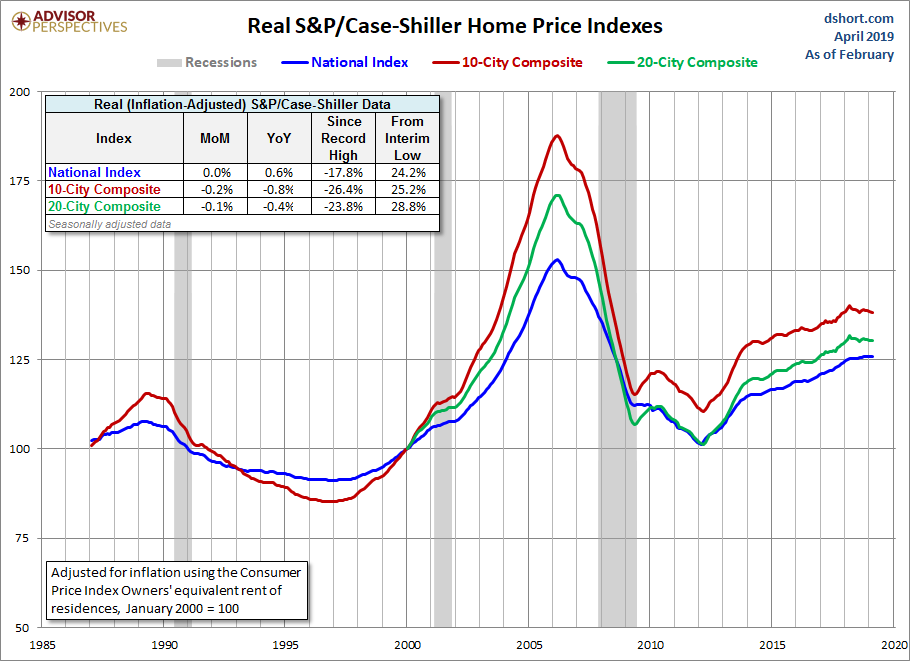
The next chart shows the year-over-year Case-Shiller series, again using the seasonally adjusted data.
(Click on image to enlarge)
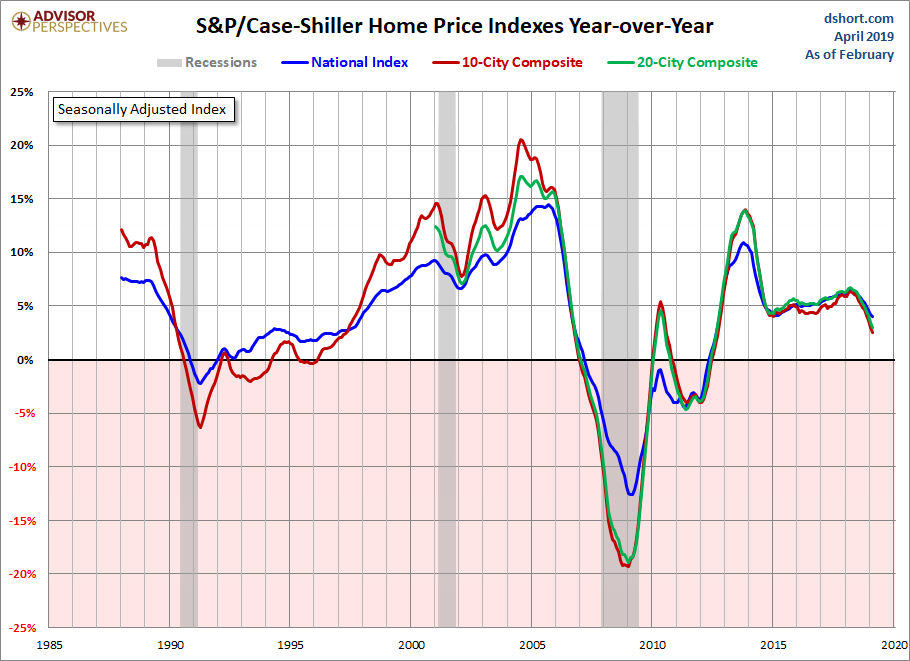
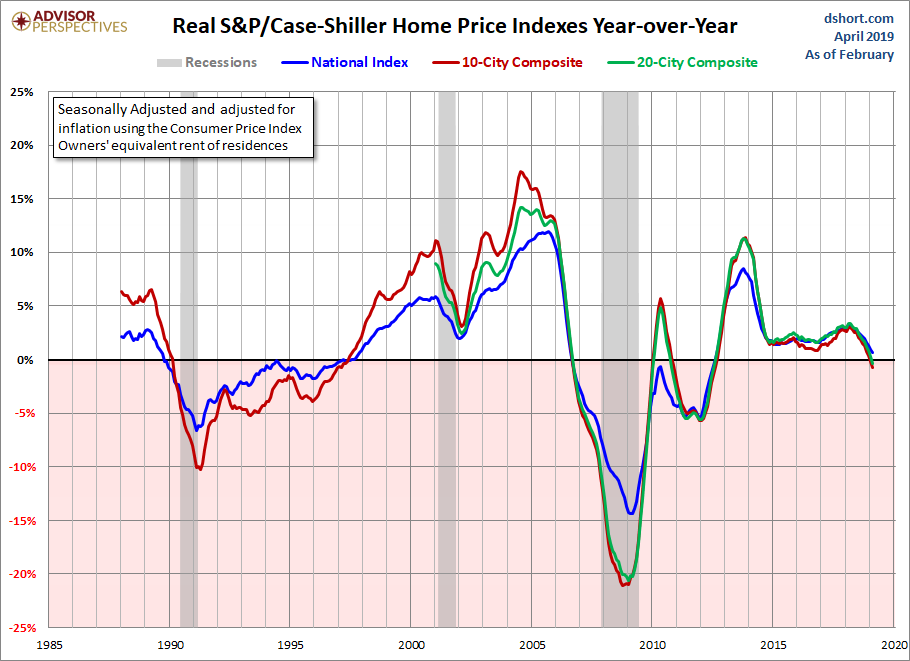
Here is the same year-over-year overlay adjusted for inflation with the Consumer Price Index owners' equivalent rent of residences.
(Click on image to enlarge)
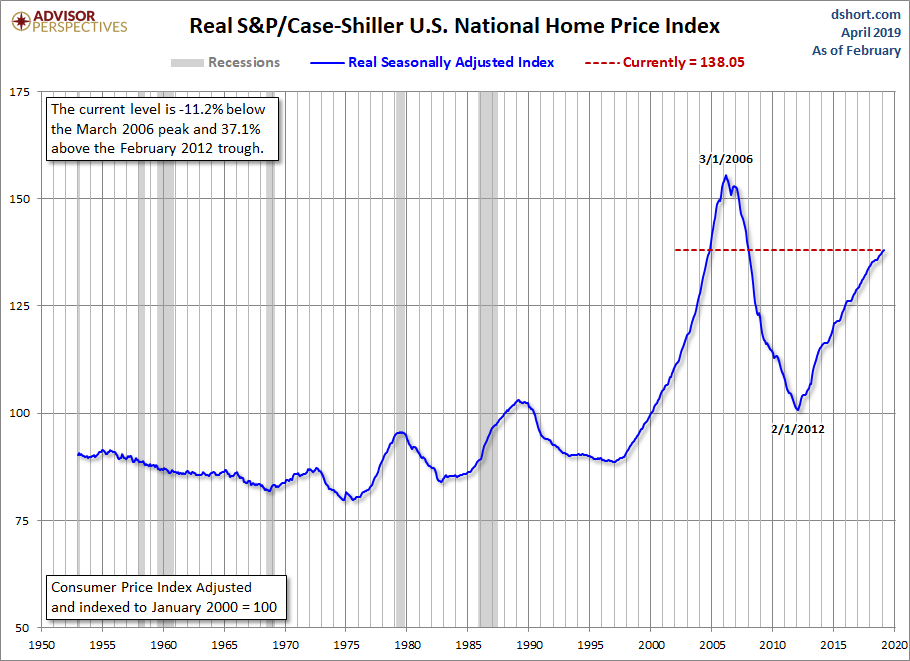
For a long-term perspective on home prices, here is a look at the seasonally and inflation-adjusted Case-Shiller price index from 1953, the first year that monthly data is available. Because the CPI owners' equivalent rent of residences didn't start until 1983, we've used the broader seasonally adjusted Consumer Price Index.
(Click on image to enlarge)
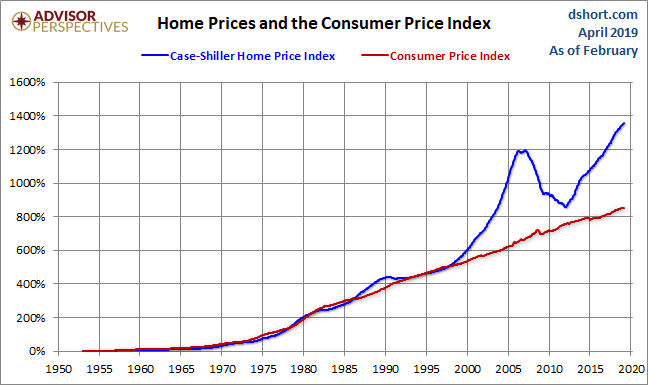
To get an even better idea of the trend in housing prices over long time periods, we compare the change in the seasonally-adjusted Case-Shiller Home Price Index and the Consumer Price Index since 1953.
(Click on image to enlarge)



Comments
Log in or sign up to join the conversation.