


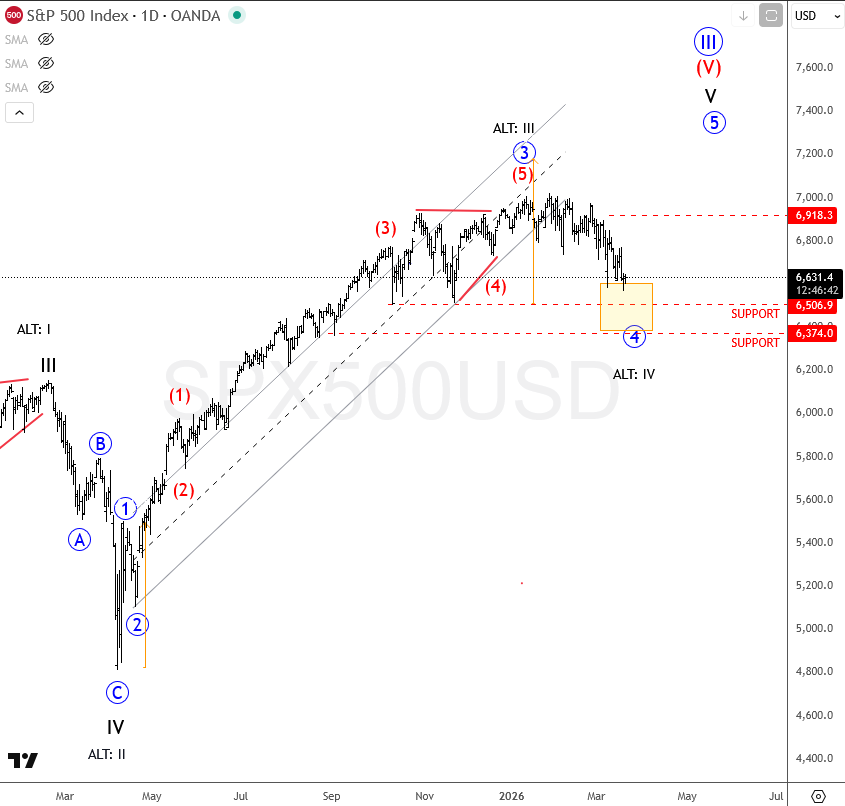
SP500 remains in a corrective phase, having reached a new low for March before stabilizing toward the end of the week. On the daily timeframe, prices appear to be in the late stages of a complex correction within wave four.
SP500 Daily Chart
Key support from November around 6500 is critical. A successful retest of this level could trigger a more substantial rebound. Conversely, if the index breaks below 6763, it would indicate that the higher-degree wave four is still extending lower, and the corrective move is not yet complete.
Traders should watch these levels closely on the daily chart for signals of a potential shift in trend.
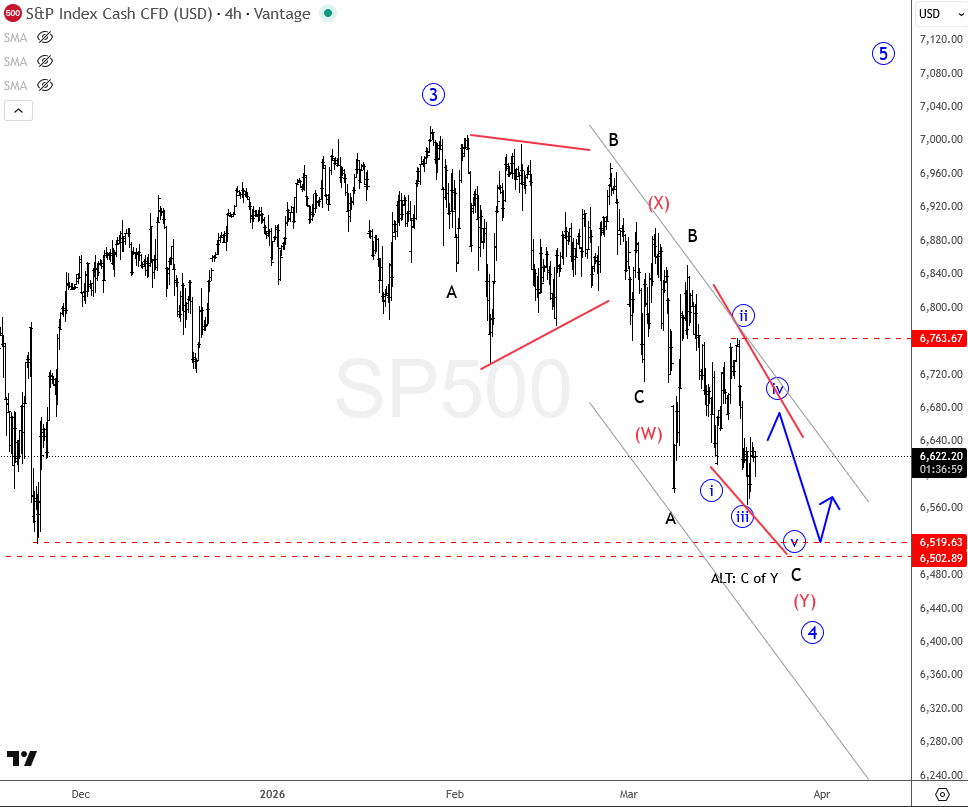
Zooming into the 4-hour timeframe, the S&P 500 is trading within a well-defined downward channel. Short-term price action suggests momentum is still biased to the downside, but there are early signs of potential exhaustion near current support levels.
SP500 4H Chart
A breakout above the channel could signal the start of a short-term rebound, while a continuation lower would confirm that wave four is still unfolding. The 4-hour chart provides more precise entry and exit points for swing traders looking to take advantage of smaller moves within the broader corrective phase.
Conclusion:
Both daily and 4-hour charts highlight the importance of the 6500 support zone. While a rebound could be imminent, a break below 6763 would extend the corrective phase further. Traders should combine these timeframes to manage risk and identify potential opportunities.



Comments
Log in or sign up to join the conversation.