

This is an alternative visualization of the eMini S&P Futures in the regular session. I created the chart using 30 minute intervals from the open to the close.
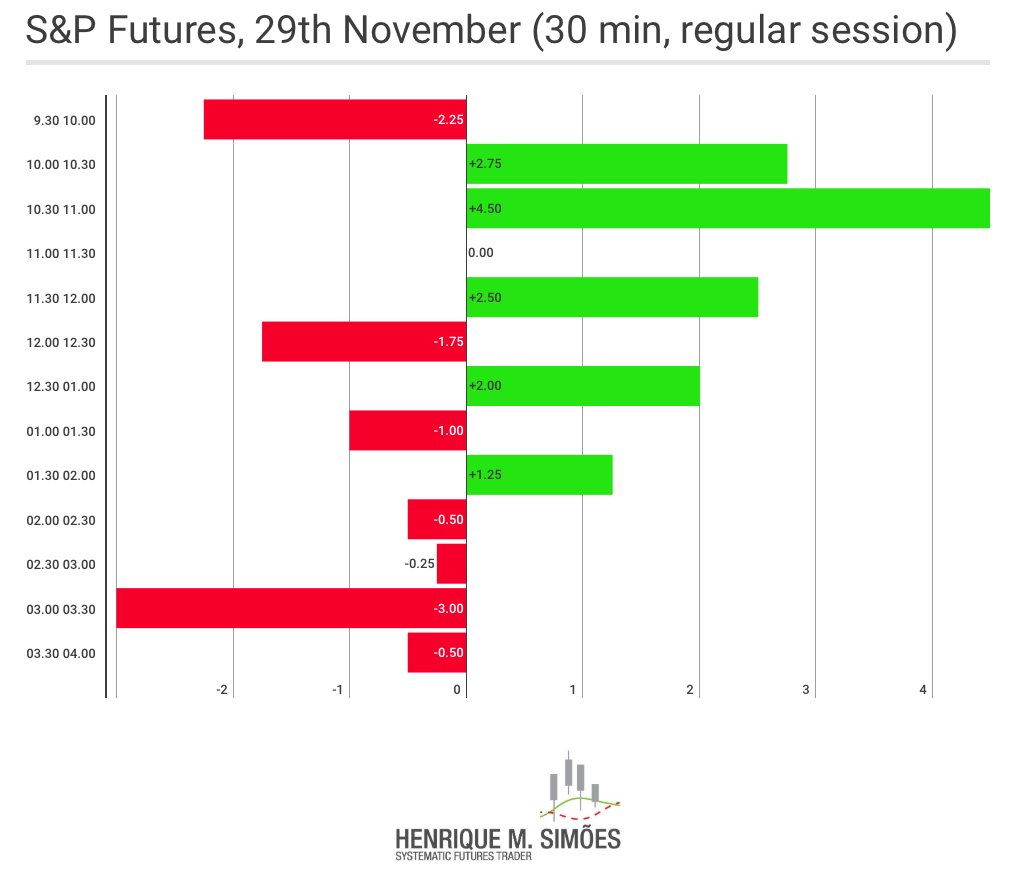
The idea is to allow traders to pinpoint patterns and allow traders to collect a quick snapshot of the daily action in one of the most liquid futures contracts in the world. This data can be used not only to spot price patterns but also to recognize changes in volatility and price persistency.



Comments
Log in or sign up to join the conversation.