
(Click on image to enlarge)
Is the S&P starting out a new month and quarter at a very important price point? This chart would say YES!
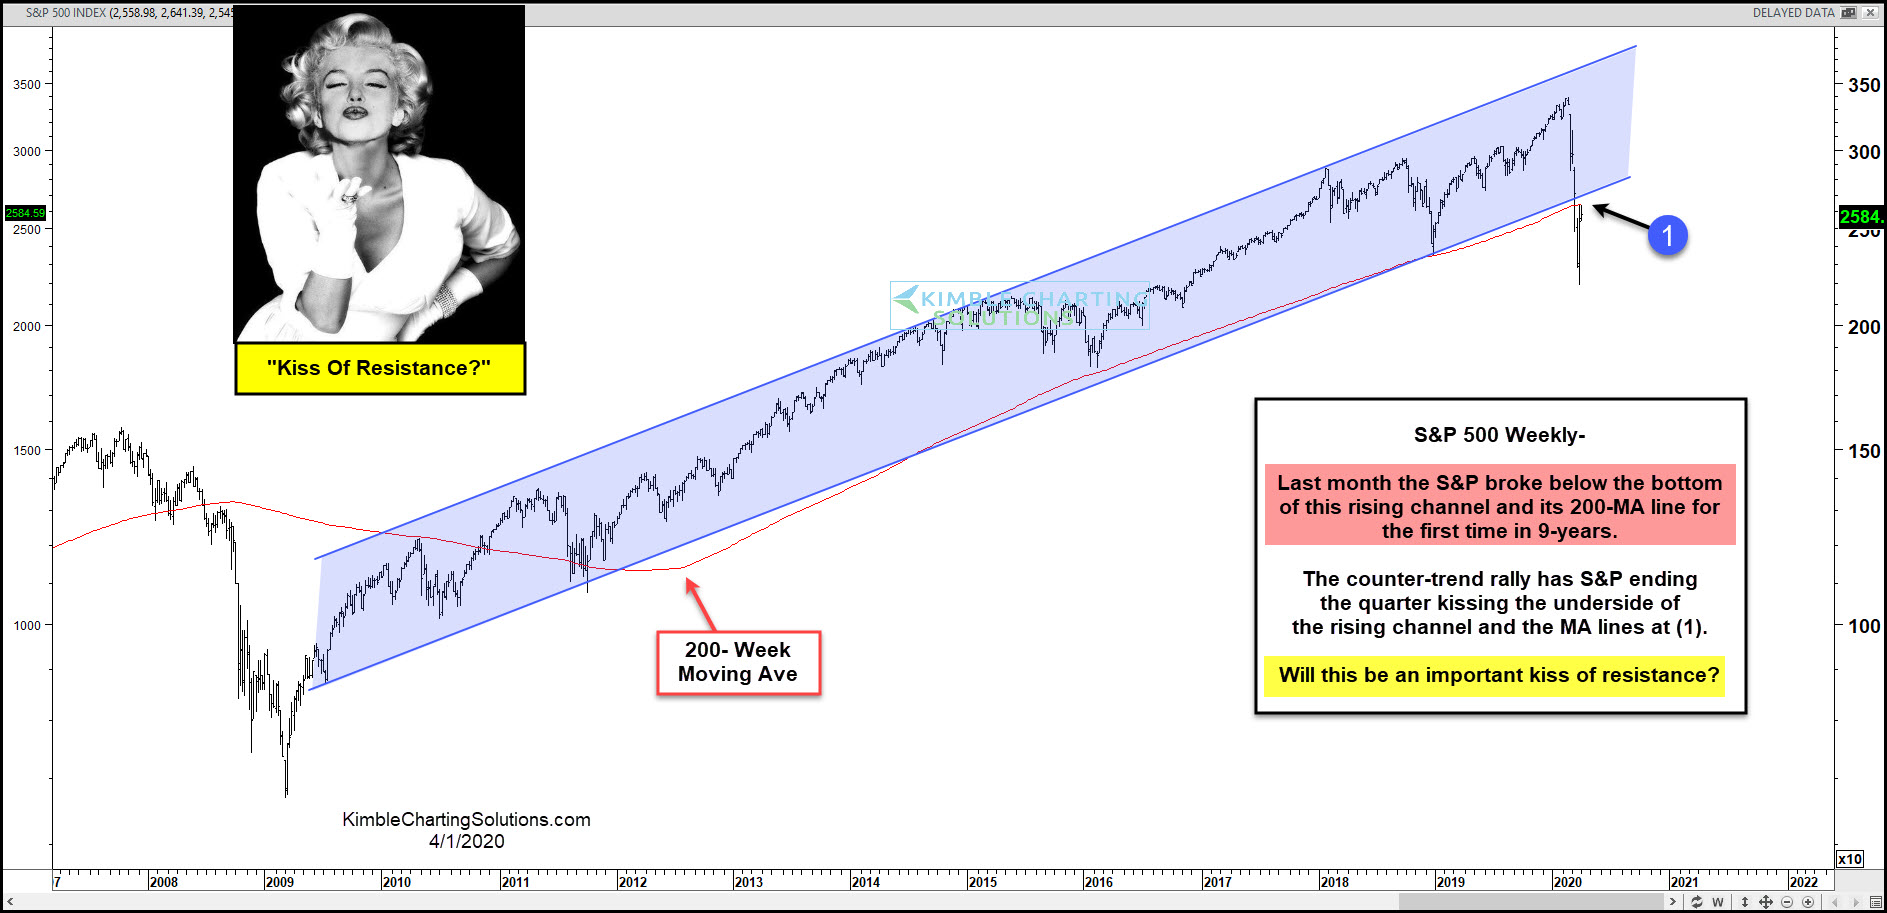
This chart looks at the S&P 500 on a weekly basis over the past 12-years, reflecting that it has spent the majority of the past 9-years “inside of this rising channel and above its 200-week moving average!”
The weakness in March saw the S&P break below the bottom of the channel and its 200-week ma line for the first time in 9-years.
The small counter-trend rally last week has the S&P starting out the month/quarter kissing the underside of the channel and MA line, which now come into play as resistance for the first time in nearly a decade.
Is the S&P facing a very important kiss of resistance at (1)? At this time it is!


Comments
Log in or sign up to join the conversation.