

The non-seasonally adjusted S&P CoreLogic Case-Shiller home price index (20 cities - although only 19 cities this month) year-over-year rate of home price growth declined from 3.9 % to 3.7 %. The index authors stated, "More data will obviously be required in order to know whether May's report represents a reversal of the previous path of accelerating prices or merely a slight deviation from an otherwise intact trend. ".

Analyst Opinion of Case-Shiller HPI
All home price indices are now showing home price growth is slowing year-over-year. Most of the blame for this should be laid at the feet of the pandemic which has altered daily lives.
- 20 city unadjusted home price rate of growth accelerated by 0.1 % month-over-month. [Econintersect uses the change in year-over-year growth from month-to-month to calculate the change in the rate of growth]
- Note that the Case-Shiller index is an average of the last three months of data.
- The market expected from Econoday:
| Consensus Range | Consensus | Actual | |
| 20-city, SA - M/M | 0.4 % to 0.5 % | +0.5 % | +0.0 % |
| 20-city, NSA - M/M | 0.8 % to 1.0 % | +0.8 % | +0.4 % |
| 20-city, NSA - Yr/Yr | 4.0 % to 4.5 % | +4.2 % | +3.7 % |
S&P/Case-Shiller Home Price Indices Year-over-Year Change
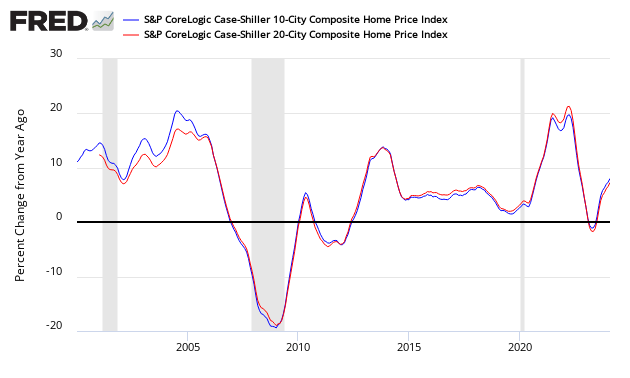
Comparing the NAR and Case-Shiller home price indices, it needs to be understood each of the indices uses a unique methodology in compiling their index - and no index is perfect.

The way to understand the dynamics of home prices is to watch the direction of the rate of change. Here home price growth is now slowing.

There are some differences between the indices on the rate of "recovery" of home prices.
When asked what today's release means for the housing market, Selma Hepp, deputy chief economist for CoreLogic said:
Housing market activity stands as a shining light for the U.S. economy and households during these challenging times, and continued demand highlights the importance of housing. Under the current economic circumstances, the safety and stability homebuying provides may have become even more critical for families. While recent data shows that the current resurgence in COVID-19 cases undermines the sustainability of economic recovery-and may restrain available for-sale homes-home buying fundamentals driven by demographics and favorable mortgage rates suggest housing demand will remain solid.
A synopsis of Authors of the Leading Indices:
Case Shiller's Craig J. Lazzara, Managing Director and Global Head of Index Investment Strategy at S&P Dow Jones Indices stated:
April's housing price data continue to be remarkably stable. The National Composite Index rose by 4.7% in April 2020, with comparable growth in the 10- and 20-City Composites (up 3.4% and 4.0%, respectively). In all three cases, April's year-over-year gains were ahead of March's, continuing a trend of gently accelerating home prices that began last fall. Results in April continued to be broad-based. Prices rose in each of the 19 cities for which we have reported data, and price increases accelerated in 12 cities.
As was the case in March, we have data from only 19 cities this month, since transactions records for Wayne County, Michigan (in the Detroit metropolitan area) continue to be unavailable. This is, so far, the only directly visible impact of COVID-19 on the S&P CoreLogic Case-Shiller Indices. The price trend that was in place pre-pandemic seems so far to be undisturbed, at least at the national level. Indeed, prices in 12 of the 20 cities in our survey were at an all-time high in April.
Among the cities, Phoenix retains the top spot for the 11th consecutive month, with a gain of 8.8% for April. Home prices in Seattle rose by 7.3%, followed by increases in Minneapolis (6.4%) and Cleveland (6.0%). Prices were particularly strong in the West and Southeast, and comparatively weak in the Northeast.
CoreLogic believes home prices will remain firm moving forward (May 2020 Data). Per Dr. Frank Nothaft, chief economist at CoreLogic and Frank Martell, president and CEO of CoreLogic stated:
Pending sales and home-purchase loan applications are higher than in June of last year and reflect the buying activity of millennials. By the end of summer, buying will slacken and we expect home prices will show declines in metro areas that have been especially hard hit by the recession.
Home-purchase activity, bolstered by record-low interest rates, continues to exceed expectations despite the severe recession. Pent-up buyer demand was delayed from spring to summer and is reflected in the latest price data. But with elevated unemployment, purchase activity and home prices could fall off after summer.
From the National Association of Realtors (June 2020 data):
The sales recovery is strong, as buyers were eager to purchase homes and properties that they had been eyeing during the shutdown. This revitalization looks to be sustainable for many months ahead as long as mortgage rates remain low and job gains continue.
Significantly low inventory was a problem even before the pandemic and such circumstances can lead to inflated costs.
Home prices rose during the lockdown and could rise even further due to heavy buyer competition and a significant shortage of supply.
The U.S. Federal Housing Finance Agency produces an All-Transactions House Price Index for the United States:

Econintersect publishes knowledgeable views of the housing market.
Caveats on the Use of Home Price Indices
The housing price decline seen since 2005 varies by zip code - and seems to have ended somewhere around the beginning of the 2Q2012. Every area of the country has differing characteristics. Since January 2006, the housing declines in Charlotte and Denver are well less than 10%, while Las Vegas home prices had declined by almost 60%.
Each home price index uses a different methodology - and this creates slightly different answers.
The most broadly based index is the US Federal Housing Finance Agency's House Price Index (HPI) - a quarterly broad measure of the movement of single-family house prices. This index is a weighted, repeat-sales index on the same properties in 363 metro centers, compared to the 20 cities Case-Shiller.
The US Federal Housing Finance Agency also has an index (HPIPONM226S) based on 6,000,000 same home sales - a much broader index than Case-Shiller. Also, there is a big difference between home prices and owner's equity (OEHRENWBSHNO) which has been included in the graph below.
Comparing Various Home Price Indices to Owner's Equity (blue line)


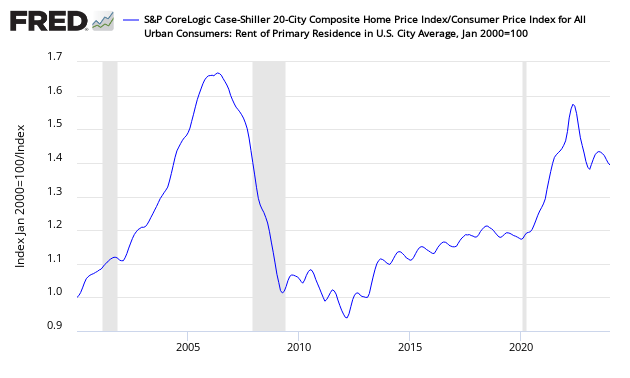
The affordability factor favors rental vs owning.
Price to Rent Ratio - Indexed on January 2000 - Based on Case-Shiller 20 cities index ratio to CPI Rent Index


Comments
Log in or sign up to join the conversation.