

The non-seasonally adjusted S and P CoreLogic Case-Shiller home price index (20 cities) year-over-year rate of home price growth decelerated from an upwardly revised 6.4 % to 5.9 %. The index authors stated "The slowing is widespread: 15 of 20 cities saw smaller monthly increases in July 2018 than in July 2017".

Analyst Opinion of Case-Shiller HPI
Many pundits believe home prices are back in a bubble. Maybe, but the falling inventory of homes for sale keeps home prices relatively high. I continue to see this a situation of supply and demand. It is the affordability of the homes which is becoming an issue for the lower segments of consumers.
- 20 city unadjusted home price rate of growth decelerated 0.5 % month-over-month. [Econintersect uses the change in year-over-year growth from month-to-month to calculate the change in rate of growth]
- Note that Case-Shiller index is an average of the last three months of data.
- The market expected from Econoday:
| Consensus Range | Consensus | Actual | |
| 20-city, SA - M/M | -0.2 % to 0.4 % | 0.1 % | +0.1 % |
| 20-city, NSA - M/M | 0.5 % to 0.6 % | 0.5 % | 0.3 % |
| 20-city, NSA - Yr/Yr | 6.2 % to 6.5 % | 6.3 % | +5.9 % |
S&P/Case-Shiller Home Price Indices Year-over-Year Change
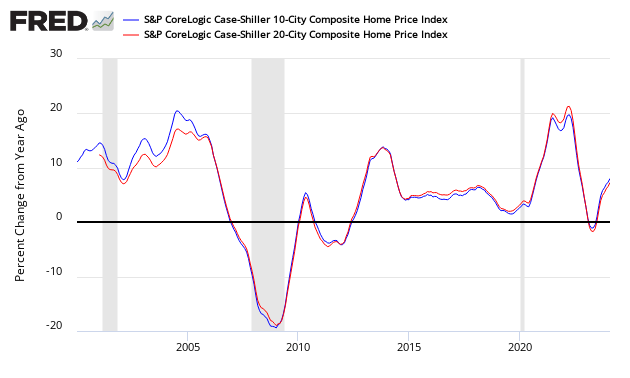
Comparing the NAR and Case-Shiller home price indices, it needs to be understood each of the indices uses a unique methodology in compiling their index - and no index is perfect.

The way to understand the dynamics of home prices is to watch the direction of the rate of change. Here home price growth generally appears to stabilize (rate of growth not rising or falling).

There are some differences between the indices on the rate of "recovery" of home prices.
A synopsis of Authors of the Leading Indices:
Case Shiller's David M. Blitzer, Chairman of the Index Committee at S&P Indices:
Rising homes prices are beginning to catch up with housing. Year-over-year gains and monthly seasonally adjusted increases both slowed in July for the S&P Corelogic Case-Shiller National Index and the 10 and 20-City Composite indices. The slowing is widespread: 15 of 20 cities saw smaller monthly increases in July 2018 than in July 2017. Sales of existing single family homes have dropped each month for the last six months and are now at the level of July 2016. Housing starts rose in August due to strong gains in multifamily construction. The index of housing affordability has worsened substantially since the start of the year.
Since home prices bottomed in 2012, 12 of the 20 cities tracked by the S&P Corelogic Case-Shiller indices have reached new highs before adjusting for inflation. The eight that remain underwater include the four cities which led the home price boom: Las Vegas, Miami, Phoenix and Tampa. All are enjoying rising prices, especially Las Vegas which currently has the largest year-over-year increases of all 20 cities. The other cities where prices are still not over their earlier peaks are Washington DC, Chicago, New York and Atlanta.
CoreLogic believes low inventories are spurring rising home prices (July 2018 Data). Per Dr. Frank Nothaft, chief economist for CoreLogic and Frank Martell, president and CEO of CoreLogic stated:
With increased interest rates and home prices, the CoreLogic Home Price Index is rising at a slower rate than it was a year ago. While markets in the western part of the country continue to experience rapid home-price growth, many of those metros are overvalued, and will likely experience a slowdown soon.
.... Many consumers see their homes as good investments. Our consumer research indicates homeowners, especially those in high-price growth markets, are confident that by waiting to sell, they will receive a greater return on investment than they would today. In other words, sellers are largely staying put. With fewer homes on the market, price pressure will continue to rise.
The National Association of Realtors says home sales prices continue to increase (August 2018 data):
Lawrence Yun, NAR chief economist, says the decline in existing home sales appears to have hit a plateau with robust regional sales. "Strong gains in the Northeast and a moderate uptick in the Midwest helped to balance out any losses in the South and West, halting months of downward momentum," he said. "With inventory stabilizing and modestly rising, buyers appear ready to step back into the market."
"While inventory continues to show modest year over year gains, it is still far from a healthy level and new home construction is not keeping up to satisfy demand," said Yun. "Homes continue to fly off the shelves with a majority of properties selling within a month, indicating that more inventory - especially moderately priced, entry-level homes - would propel sales."
"Rising interests rates along with high home prices and lack of inventory continues to push entry-level and first time home buyers out of the market," said Yun. "Realtors® continue to report that the demand is there - that current renters want to become homeowners - but there simply are not enough properties available in their price range."
"Realtors® across the country report that their clients waver about the decision to list their home; they are excited by the prospect of receiving many offers, they are concerned that they will not be able to find a new home to purchase," said NAR President Elizabeth Mendenhall, a sixth-generation Realtor® from Columbia, Missouri and CEO of RE/MAX Boone Realty. "Unfortunately this fluctuating view is contributing to the short supply of homes. Buyers hoping to find an entry level home in this market should work with a Realtor® and be prepared to move quickly as listings sell quickly."
The U.S. Federal Housing Finance Agency produces an All-Transactions House Price Index for the United States:

Econintersect publishes knowledgeable views of the housing market.
Caveats on the Use of Home Price Indices
The housing price decline seen since 2005 varies by zip code - and seems to have ended somewhere around the beginning of the 2Q2012. Every area of the country has differing characteristics. Since January 2006, the housing declines in Charlotte and Denver are well less than 10%, while Las Vegas home prices had declined almost 60%.
Each home price index uses a different methodology - and this creates slightly different answers.
The most broadly based index is the US Federal Housing Finance Agency's House Price Index (HPI) - a quarterly broad measure of the movement of single-family house prices. This index is a weighted, repeat-sales index on the same properties in 363 metro centers, compared to the 20 cities Case-Shiller.
The US Federal Housing Finance Agency also has an index (HPIPONM226S) based on 6,000,000 same home sales - a much broader index than Case-Shiller. Also, there is a big difference between home prices and owner's equity (OEHRENWBSHNO) which has been included on the graph below.
Comparing Various Home Price Indices to Owner's Equity (blue line)

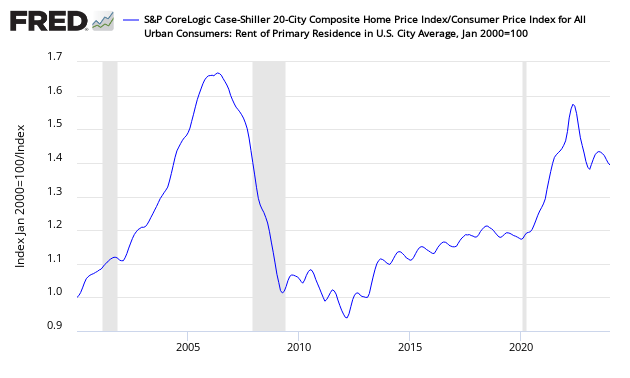
The affordability factor favors rental vs owning.
Price to Rent Ratio - Indexed on January 2000 - Based on Case-Shiller 20 cities index ratio to CPI Rent Index


Comments
Log in or sign up to join the conversation.