

This/Next Week Forecast (October 19 - 23, 2020)
Uptrend scenario
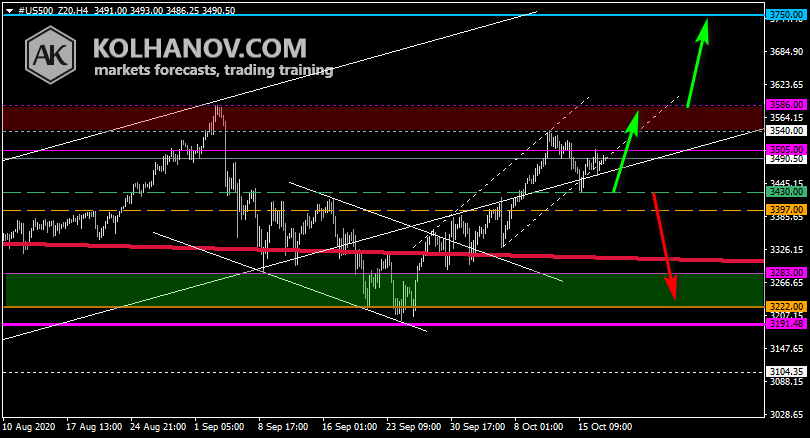
The uptrend may be expected to continue, while S&P 500 is trading above support level 3430, which will be followed by reaching resistance level 3586 and if it keeps on moving up above that level, we may expect S&P 500 reach resistance level 3750.
Downtrend scenario
A downtrend will start as soon, as S&P 500 drops below support level 3430, which will be followed by moving down to support level 3283 - 3222.
(Click on image to enlarge)
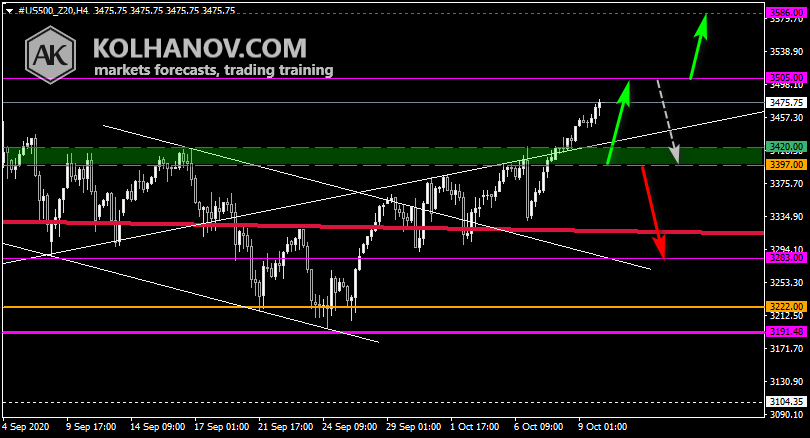
Previous week S&P 500 forecast chart
(Click on image to enlarge)
Fundamental Analysis
The slowdown in labor and manufacturing sectors showing fair price on the level 3000.
(Click on image to enlarge)

Long-Term Forecast (Quarter III: July - September, 2020)
Uptrend scenario
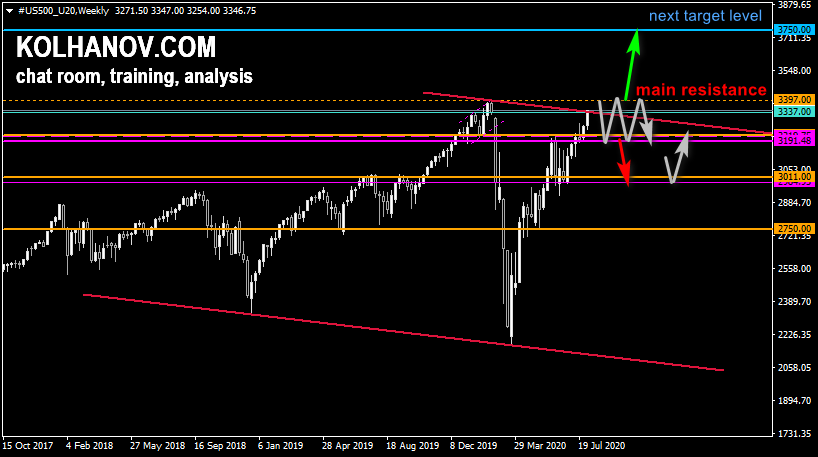
The uptrend may be expected to continue in case the market rises above resistance level 3397, which will be followed by reaching resistance level 3750.
Downtrend scenario
A downtrend will start as soon, as the pair drops below support level 3191, which will be followed by moving down to support level 3011.
(Click on image to enlarge)


Comments
Log in or sign up to join the conversation.