


US index futures have remained downbeat along with global markets. While oil prices were retreating from their overnight highs after the US and Iranian forces traded strikes on each other, WTI still held near the $90 per barrel. Bond yields were also holding onto their gains. In that environment, not many people were looking to take on risk during Asia and early European trade.
Why are markets struggling?
Risk appetite has been hurt this week with global stocks, gold, bonds and bitcoin all falling. On the ascendency have been the usual suspects: Oil and the US dollar amid further escalating tensions between the US and Iran. Stock investors are also cementing hawkish Fed expectations to an extent that it is starting to hurt their appetite for risk. Also unnerving investors is the continued rise in global bond yields – which kind of goes hand in hand with oil prices. And then there is worries about the unwinding of the yen-funded carry trade, which is hurting all sorts of risk assets, including US stocks, as reflected by the S&P 500 taking a drop in the last couple of session.
Rising bond yields starting to bite
Fed Chair Kevin Warsh’s hawkish Jackson Hole speech has already put a September rate hike firmly back on the table. This is reflected in the global bond markers selling off, sending yields higher across the curve.
In the US, the 10-year bond yield has climbed to a fresh 19-month high. The 30-year yield has also pushed through recent highs, while Japan’s 30-year yield has broken above 4.18%, a record. The latter has triggered worries about the unwinding of the carry trades, with speculation over a 50 basis point hike from the BoJ doing the rounds.
It was only two weeks ago that the US Treasury announced measures aimed at supporting the bond market, yet yields have continued to climb. The market increasingly appears willing to test the authorities’ tolerance for higher borrowing costs. With US debt now above $40tn, a sustained move in the 10-year yield towards 5% would have meaningful fiscal consequences.
With yields on the rise, this is increasing the opportunity cost of holding stocks and putting particular pressure on higher-valued, long-duration sectors such as technology.
Will upcoming data cement rate hike expectations?
The question now is whether incoming US data can further cement expectations of a September rate hike. Actually, given how hawkish the Fed Chair was at Jackson Hole, the Fed may raise rates anyway, regardless of data. Markets have one more payrolls report, due on Friday, and one more CPI release, due next week, before the September 16 FOMC meeting, alongside several secondary indicators this week.
Ahead of those, the focus will be on oil and bond markets for fresh signals. Any further gains in either of those markets could further weigh on equity markets. Higher oil prices are reigniting inflation worries, raising the risks of righter monetary policy – not just in the US but across the developed world.
S&P 500 technical analysis
From a technical analysis point of view, the S&P 500 is starting to look bearish as it has formed a couple of lower lows and lower highs, although the long-term support levels are still holding. But is it about to succumb to rising macro risks?
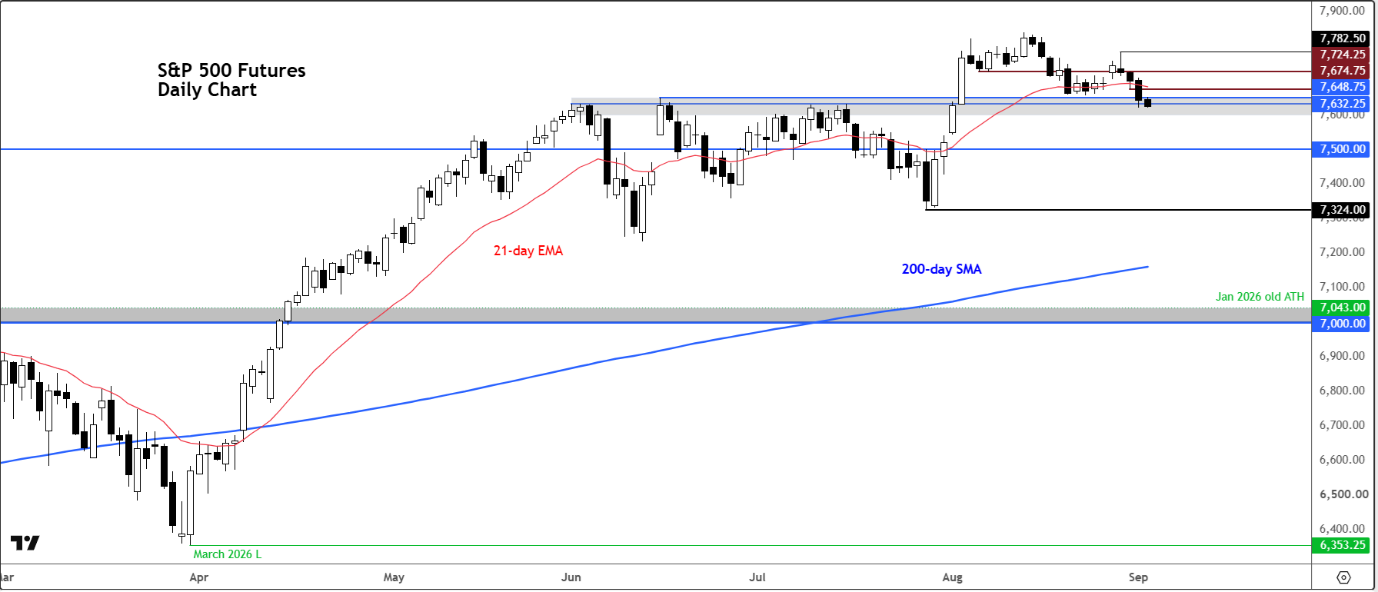
The S&P 500 future has already made a lower high at 7782, relative to its all-time high at 7838 that was hit in mid-August. That has left traders wondering whether we will now see a proper correction.
Well, a lot now depends on the key support zone that is being tested now between 7600 to 7648. Here, the index had made its previous all-time high in June, which led to a period of consolidation before the index broke out. Once resistance, will we see this zone turn into support now? It didn’t look like it at the time of writing.
If we go below the abovementioned zone, then that would be a bearish technical development. In that scenario, we could see some follow-up technical selling towards 7500 next. Below that the July low of 7324 would then come into focus.
On the upside, resistance is seen around 7674, marking Monday’s low. Above that, 7724 is the next resistance. That level held on Monday, leading to the latest drop.



Comments
Log in or sign up to join the conversation.