

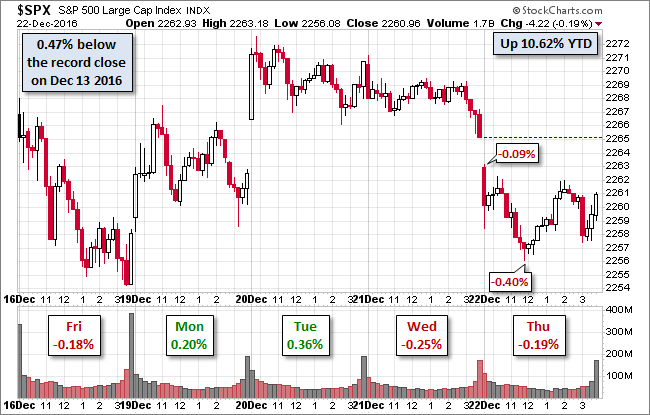
The S&P 500 posted another modest decline as it digested an avalanche of economic data today. The Third Estimate of Q3 GDP was revised upward, but the November Durable Goods were disappointing. November Personal Income was a yawner and the weekly unemployment claims came in higher than expected. The 500 hit it -0.09% intraday high in the opening seconds and sold off to its late morning -0.40% intraday low. After an afternoon zigzag, the session ended at -0.19%, the fourth loss in the seven sessions since the record close on December 13th.
Here is a snapshot of the past five sessions.
The yield on the 10-year note closed at 2.55%, unchanged from the previous close.
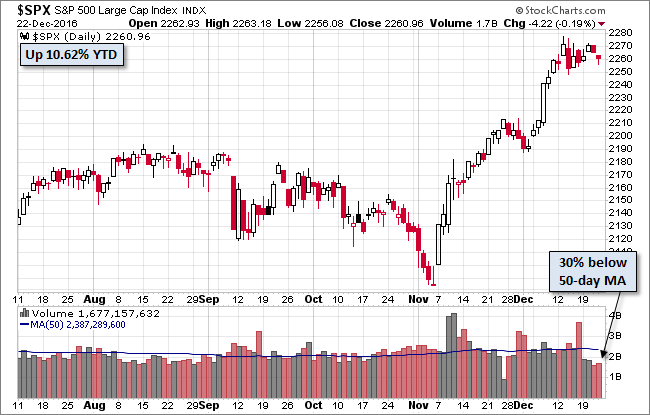
Here is daily chart of the index. Following the options expiration spike in volume on Friday, trading volume has been holiday light.
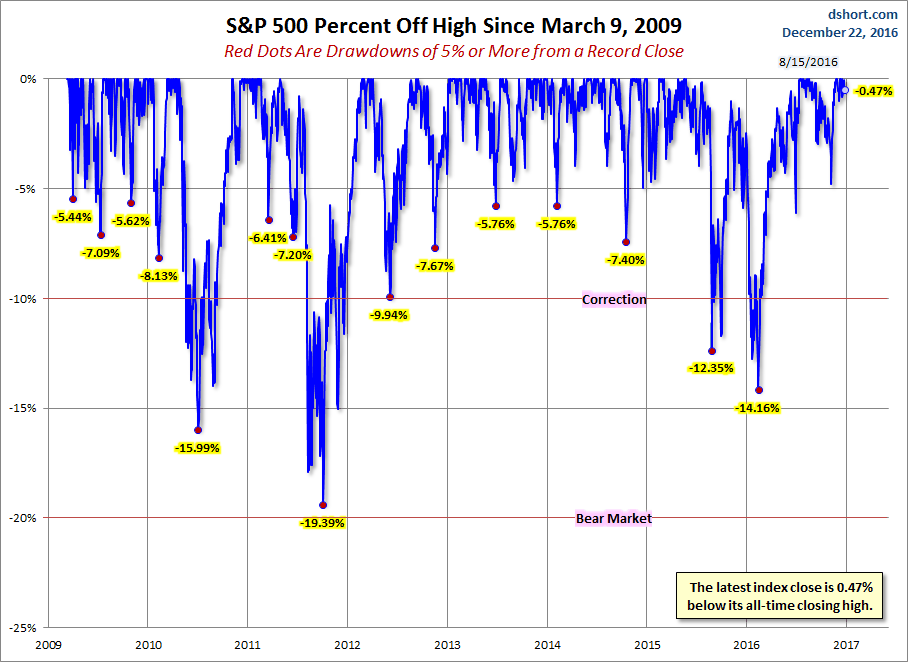
A Perspective on Drawdowns
Here's a snapshot of selloffs since the 2009 trough.
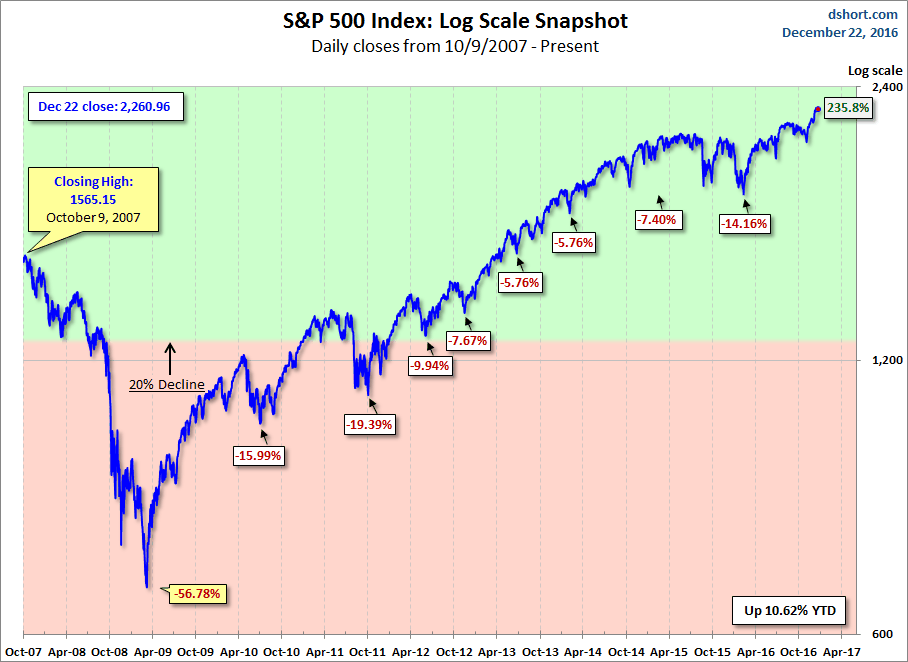
Here is a more conventional log-scale chart with drawdowns highlighted.
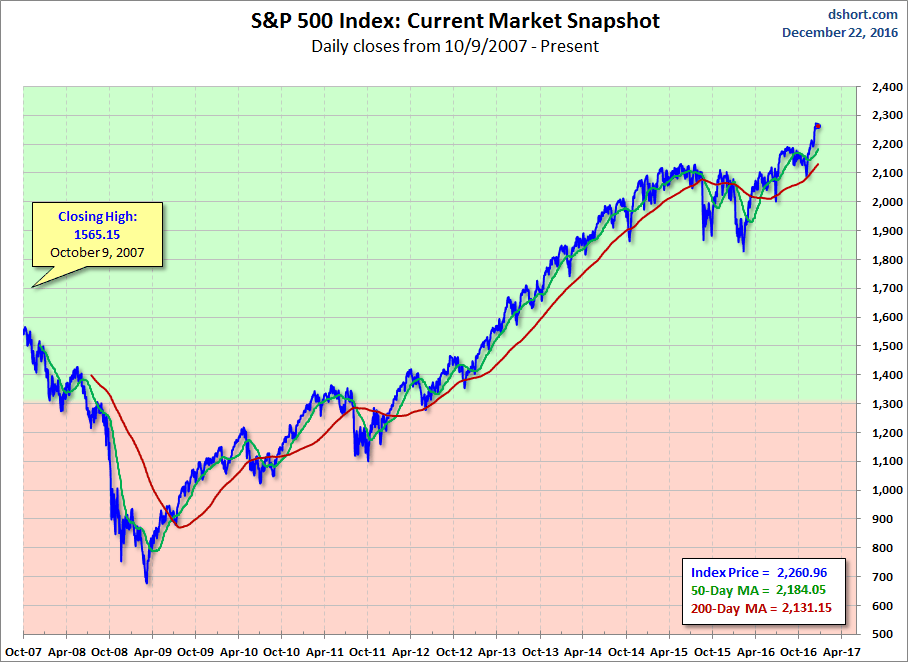
Here is a linear scale version of the same chart with the 50- and 200-day moving averages.
A Perspective on Volatility
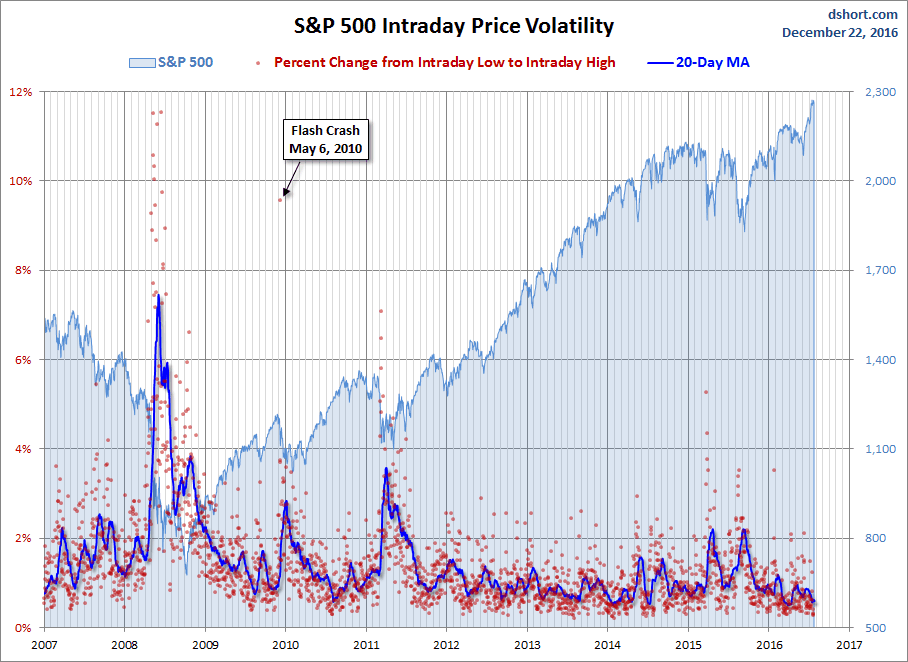
For a sense of the correlation between the closing price and intraday volatility, the chart below overlays the S&P 500 since 2007 with the intraday price range. We've also included a 20-day moving average to help identify trends in volatility.



Comments
Log in or sign up to join the conversation.