
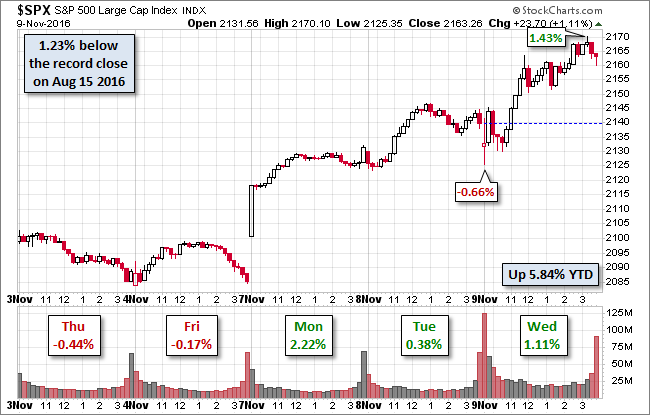
S&P 500 futures plunged last night during the presidential vote tally, but in a surprise to many analysts, the Trump win triggered a buying spree. The index was indecisive during the first 90 minutes of the session and the rose in a couple of waves to its 1.43% intraday high in the final hour of trading. The final score was an impressive 1.11% gain, the third day of a rally that has more than erased the nine-day selloff that preceded it.
But far more dramatic than the Trump equity rally was the selloff in treasuries. The 10-year Note closed the session at 2.07%, up an astonishing 19 BPs from the previous close.
Here is a snapshot of the past five sessions.
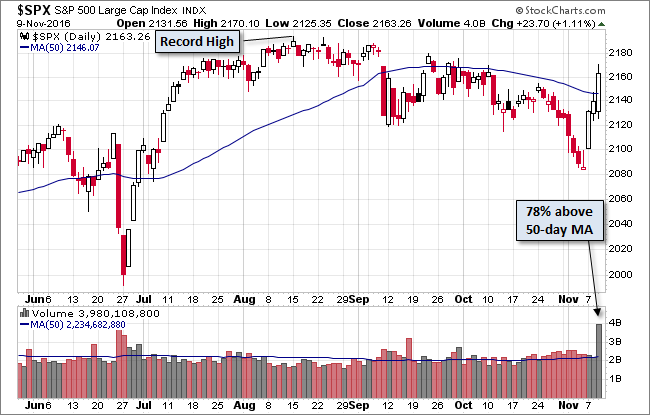
Here's a daily chart of the index. Volume on today's trade underscored the post-election rally.
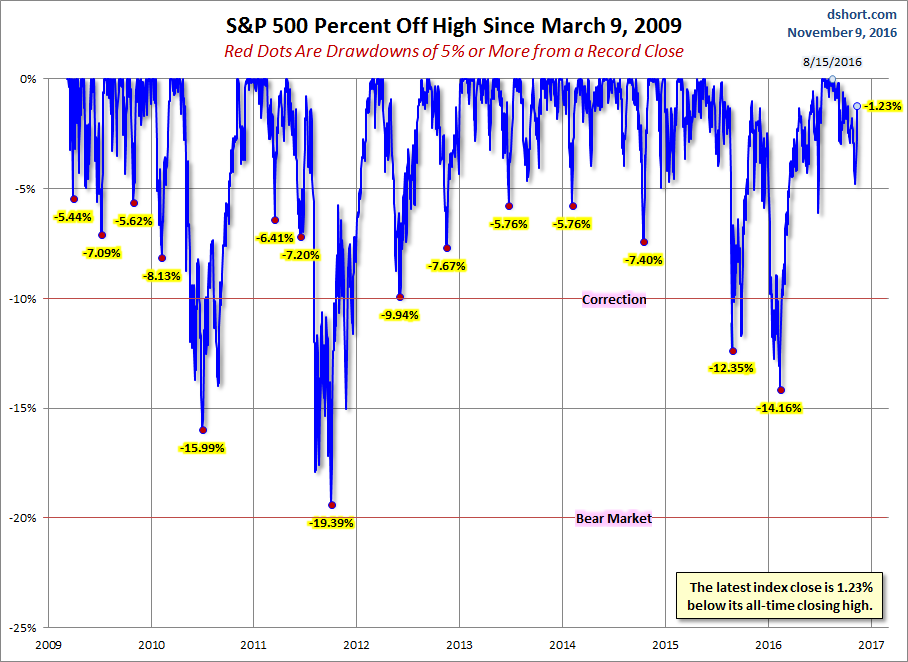
A Perspective on Drawdowns
Here's a snapshot of selloffs since the 2009 trough.
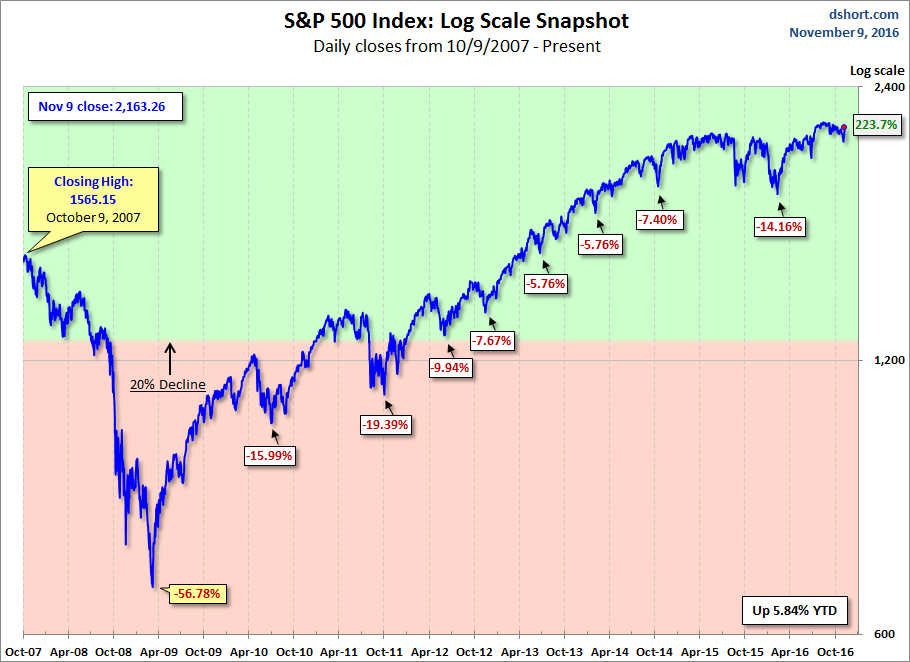
Here is a more conventional log-scale chart with drawdowns highlighted.
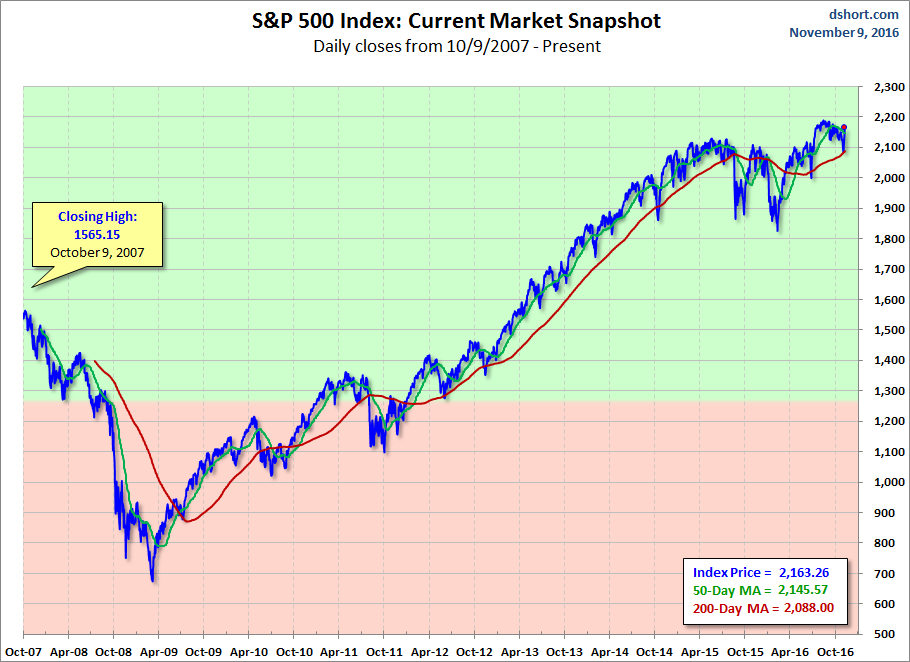
Here is a linear scale version of the same chart with the 50- and 200-day moving averages.
A Perspective on Volatility
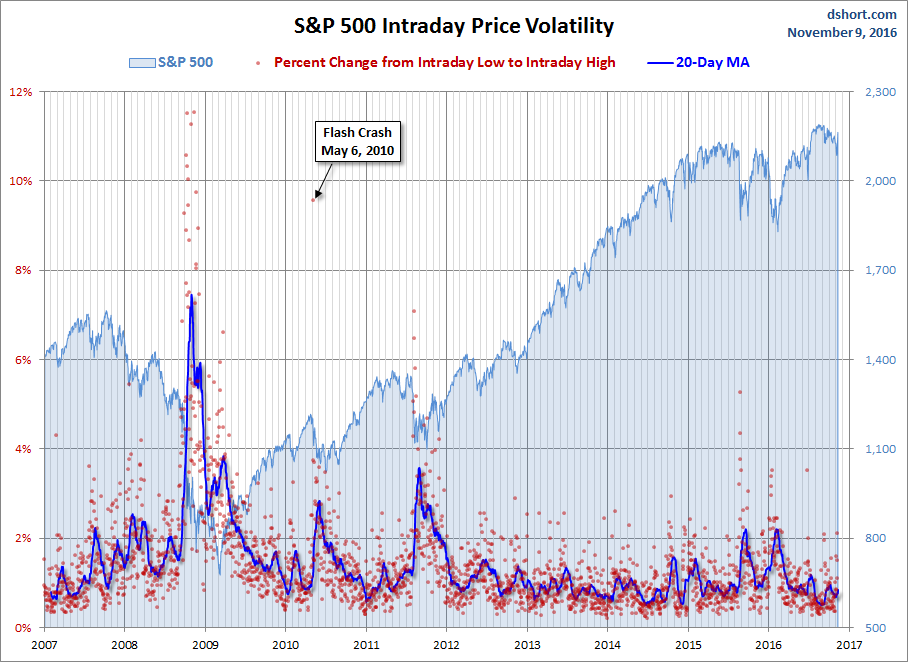
For a sense of the correlation between the closing price and intraday volatility, the chart below overlays the S&P 500 since 2007 with the intraday price range. We've also included a 20-day moving average to help identify trends in volatility.


Comments
Log in or sign up to join the conversation.