

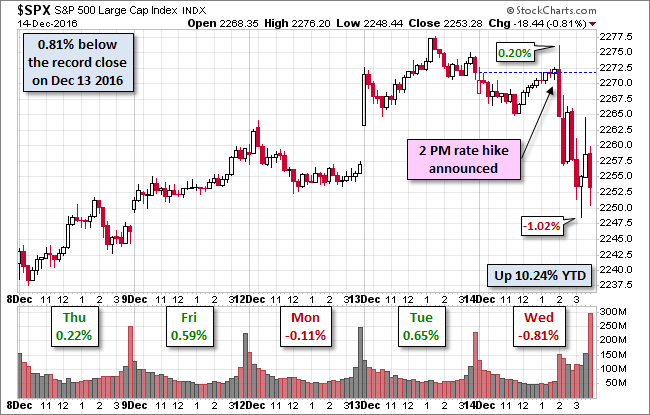
Yesterday's record close in the S&P 500 was followed today by fairly routine gaming the Fed session. Last December the Fed announced the first rate hike in a nearly a decade and forecast four more hikes in 2016. Finally today they announced the one and only 2016. The 500 traded in relatively narrow range, mostly in the shallow red until 2 PM Fed release. As the chart illustrates, in both price and volume, the index experienced a not-surprising mini-tempest, hitting its intraday high at 2:04 PM and then selling off (with a "buy" head fake) to its -1.02% intraday low a little over an hour later. Subsequent volatility led to the trimmed 0.81% loss.
Here is a snapshot of the past five sessions.
(Click on image to enlarge)
The yield on the 10-year note closing at 2.54%, up six BPs from its previous close and the highest closing yield since September 24, 2014.
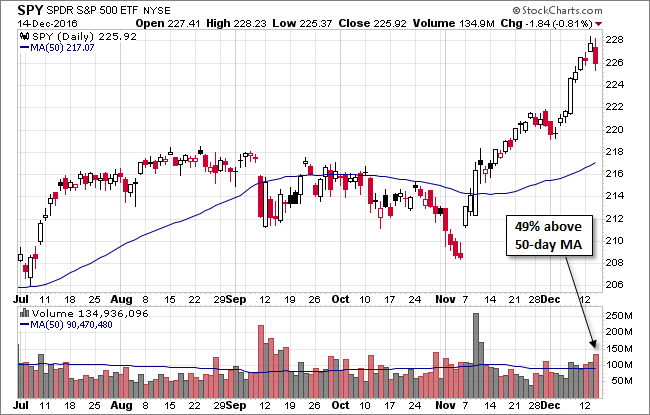
Here is a daily chart of the SPY ETF, which gives us a better sense of investor participation in today's selloff. Trading volume was the highest since the Wednesday following the Trump win.
(Click on image to enlarge)
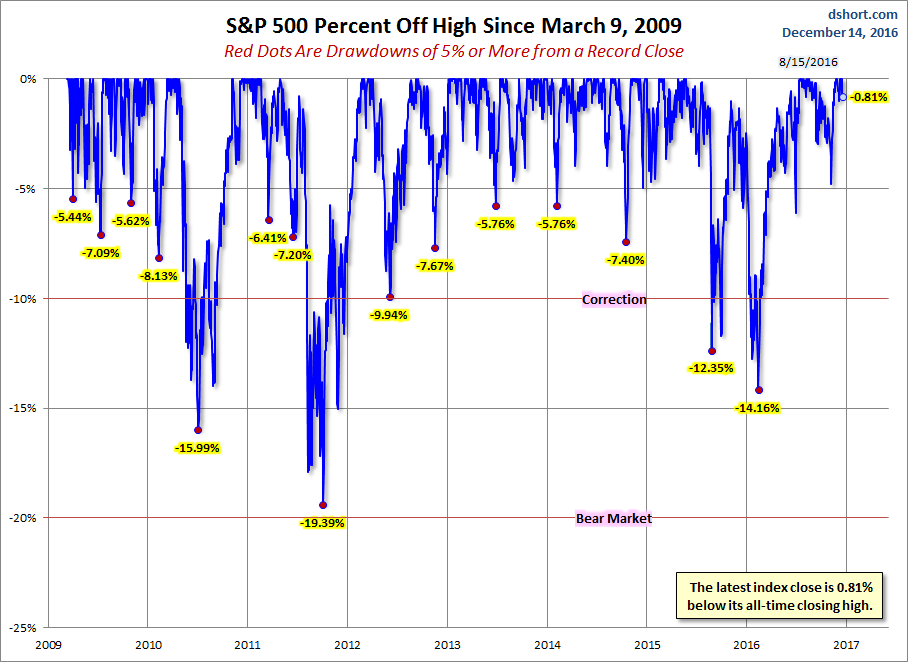
A Perspective on Drawdowns
Here's a snapshot of selloffs since the 2009 trough.
(Click on image to enlarge)
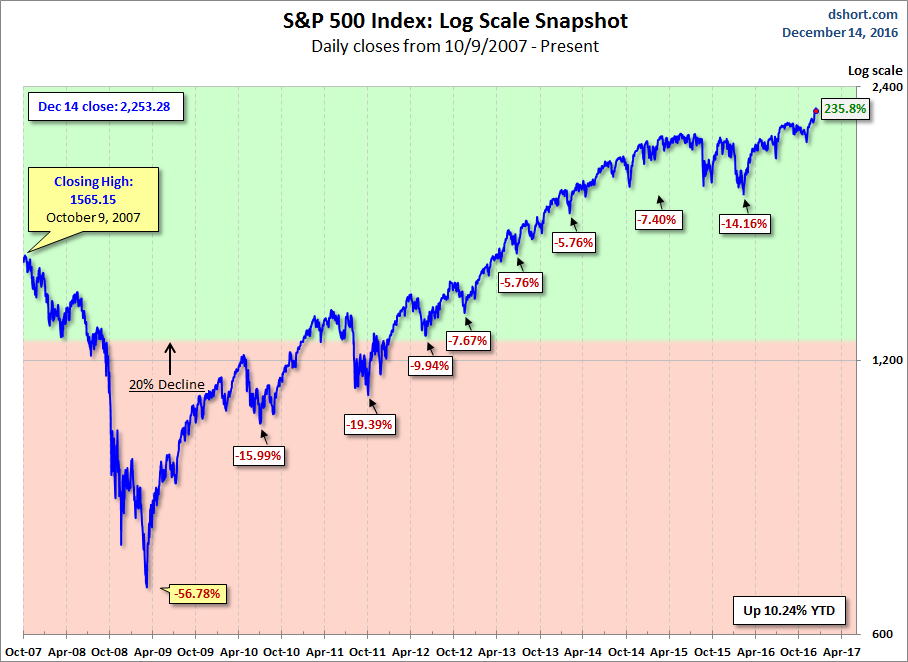
Here is a more conventional log-scale chart with drawdowns highlighted.
(Click on image to enlarge)
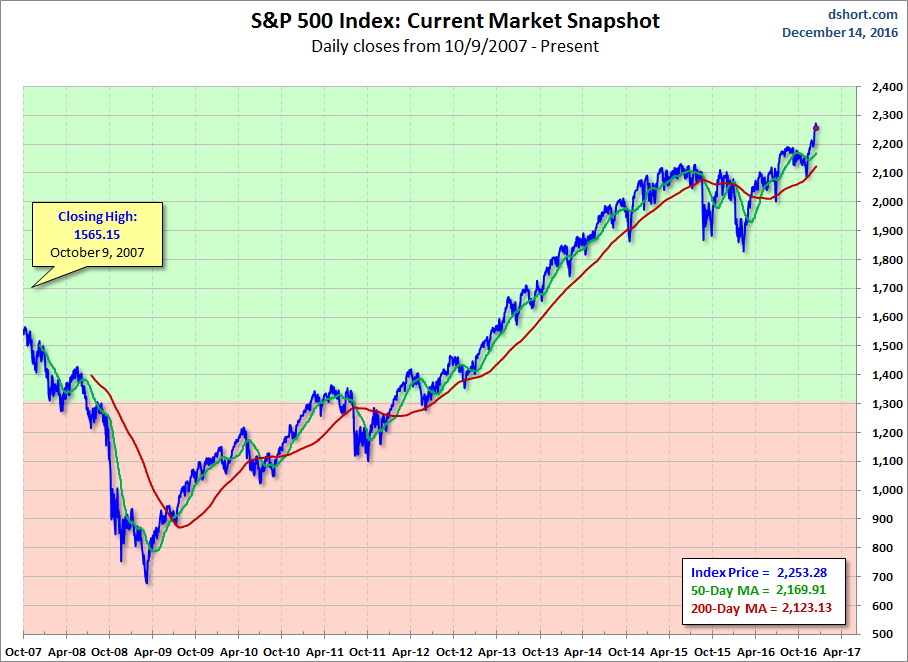
Here is a linear scale version of the same chart with the 50- and 200-day moving averages.
(Click on image to enlarge)
A Perspective on Volatility
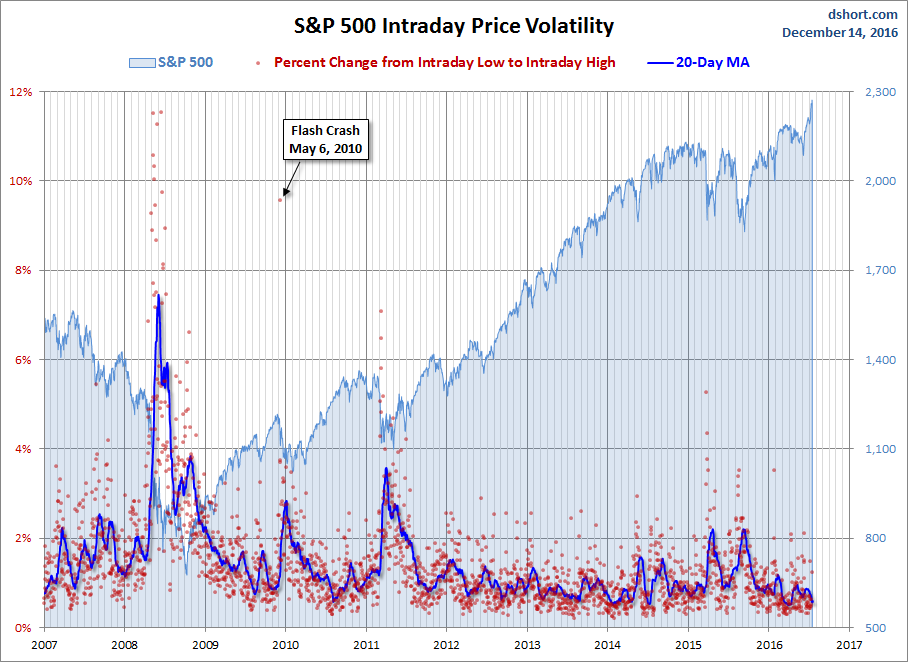
For a sense of the correlation between the closing price and intraday volatility, the chart below overlays the S&P 500 since 2007 with the intraday price range. We've also included a 20-day moving average to help identify trends in volatility.
(Click on image to enlarge)



Comments
Log in or sign up to join the conversation.