

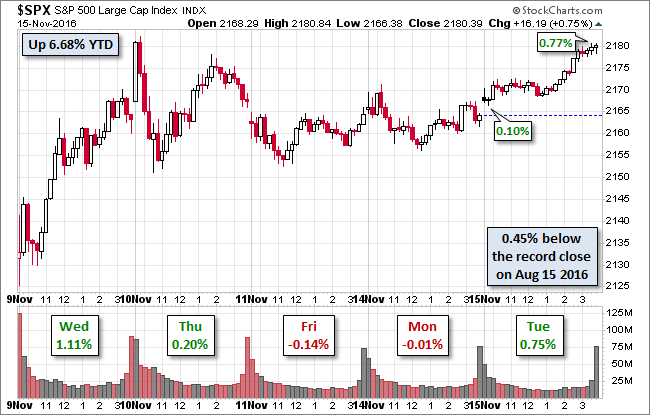
After a two-day pause, the election rally in the S&P 500 resumed today with a 0.75% gain, just a couple of ticks off its intraday high shortly before the close. The 500 is now only 0.45% from a new record close. Of course, its elderly cousin the Dow has advanced continuously for seven sessions, the last four of which were record closes. The sell-off in treasuries went on hold today. The yield on the 10-year note ended the day at 2.23%, unchanged from the previous close but a 40 BPs rise from the pre-election close.
Here is a snapshot of the past five sessions.
(Click on image to enlarge)
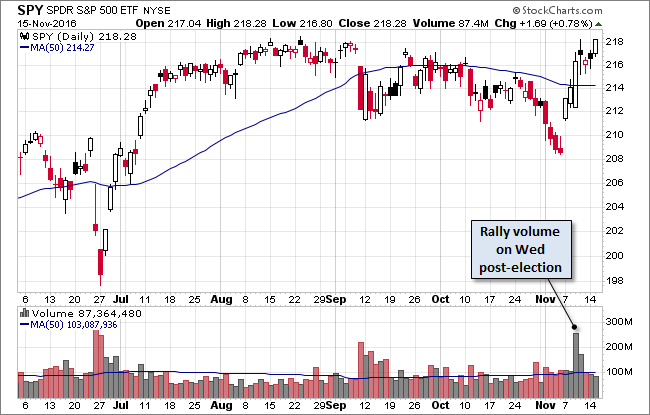
Here's a daily chart of the SPY ETF, which gives a better sense of investor participation than the underlying index. Trading volume surged on Wednesday following the election and remained elevated on Thursday. Volume for the three following sessions has been unremarkable.
(Click on image to enlarge)
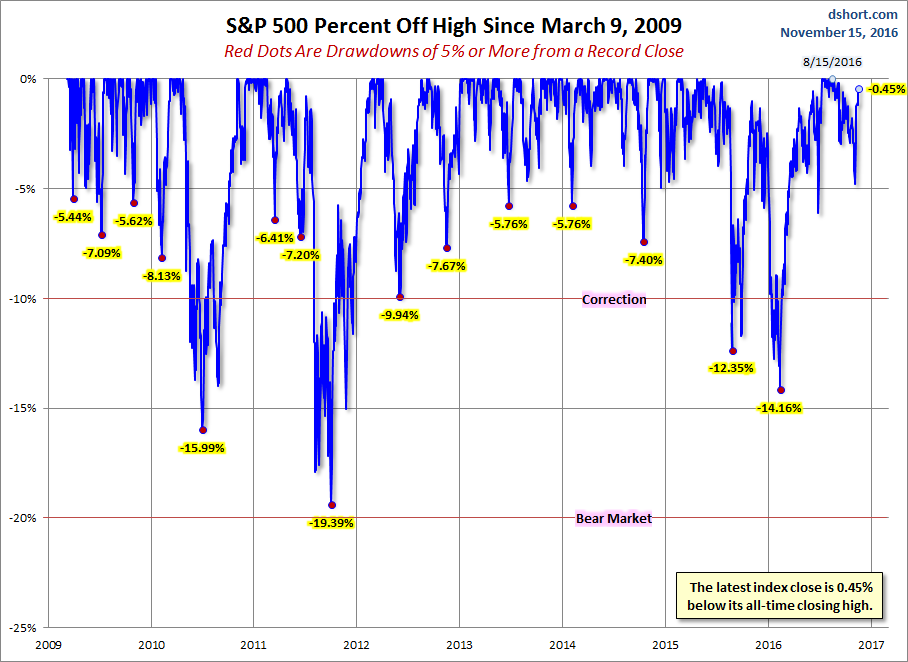
A Perspective on Drawdowns
Here's a snapshot of selloffs since the 2009 trough.
(Click on image to enlarge)
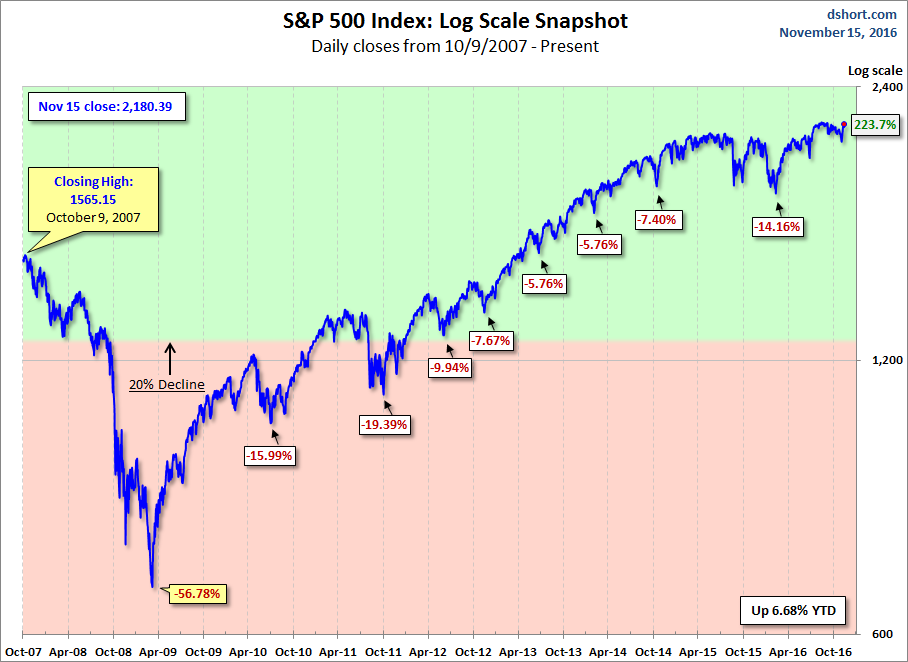
Here is a more conventional log-scale chart with drawdowns highlighted.
(Click on image to enlarge)
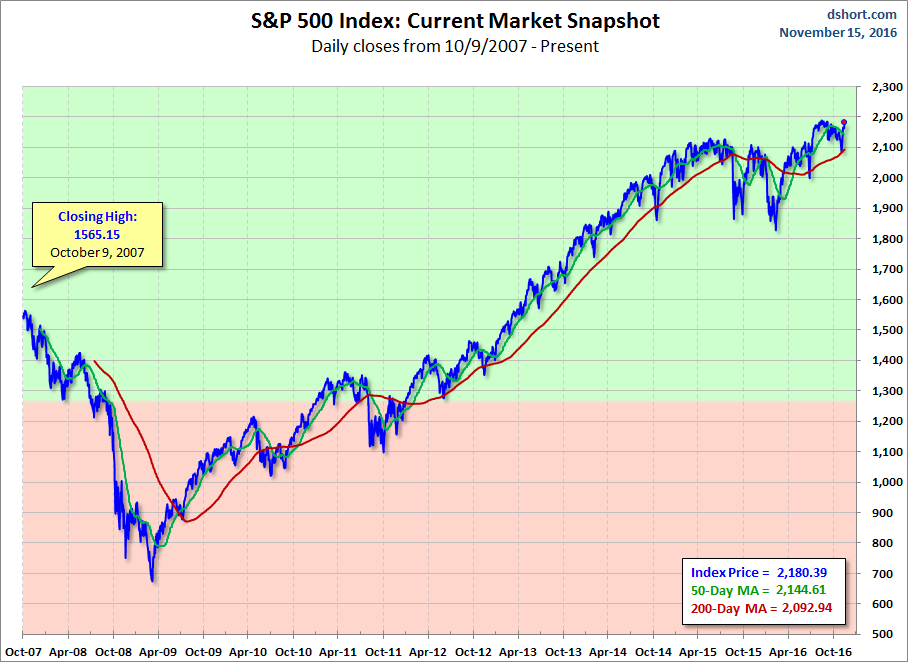
Here is a linear scale version of the same chart with the 50- and 200-day moving averages.
(Click on image to enlarge)
A Perspective on Volatility
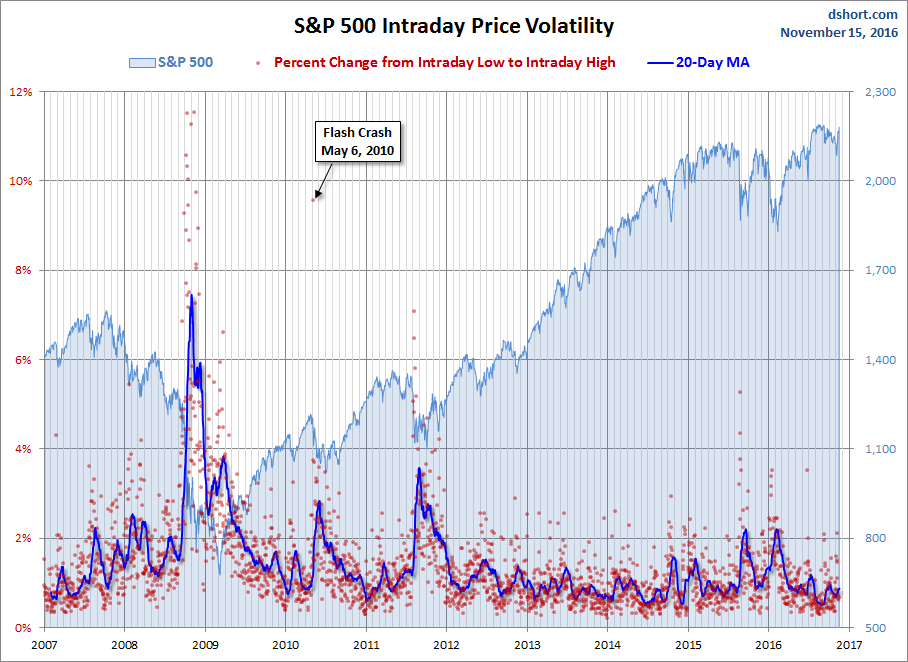
For a sense of the correlation between the closing price and intraday volatility, the chart below overlays the S&P 500 since 2007 with the intraday price range. We've also included a 20-day moving average to help identify trends in volatility.
(Click on image to enlarge)



Comments
Log in or sign up to join the conversation.