

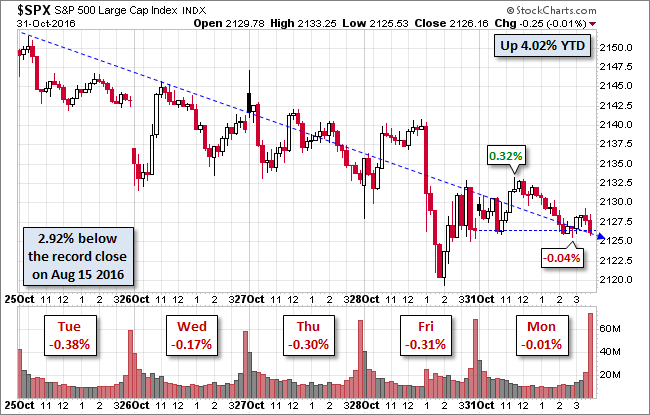
Stocks went nowhere today. All three of the widely tracked US indexes finished in the shallow red. Our preferred benchmark S&P 500 opened higher bounced off Friday's closing price to its modest 0.32% intraday high in the late morning. It then sold off steadily to that same Friday close trampoline, made a tiny bounce and then closed flat with its fifth consecutive loss, albeit a minuscule -0.01%. The is the first five-day selloff since mid-June.
The 10-year closed the session at 1.84%, down two BPs from the previous close.
Here is a snapshot of past five sessions in the S&P 500. Interestingly enough the trendline is a residual from the 5-day chart we posted on Friday ... exactly the same slope from the five-day high to the latest close.
(Click on image to enlarge)
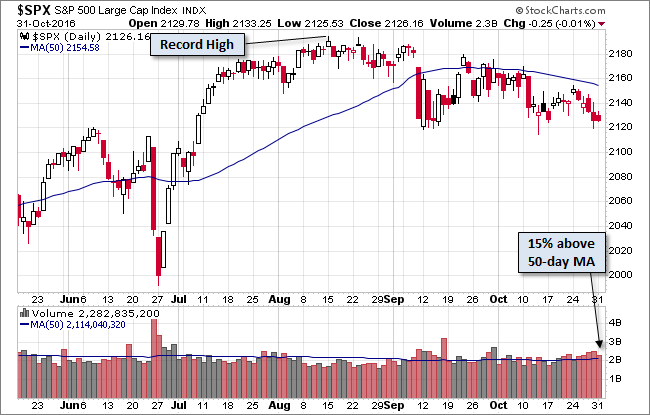
Here's a daily chart of the index. Trading volume on the last day of the month was unremarkable.
(Click on image to enlarge)
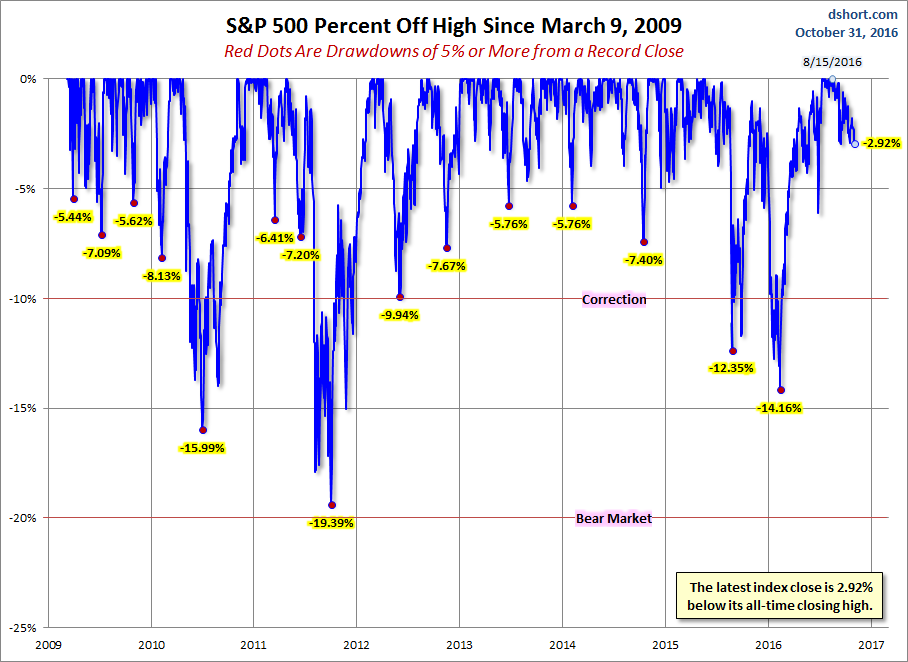
A Perspective on Drawdowns
Here's a snapshot of selloffs since the 2009 trough.
(Click on image to enlarge)
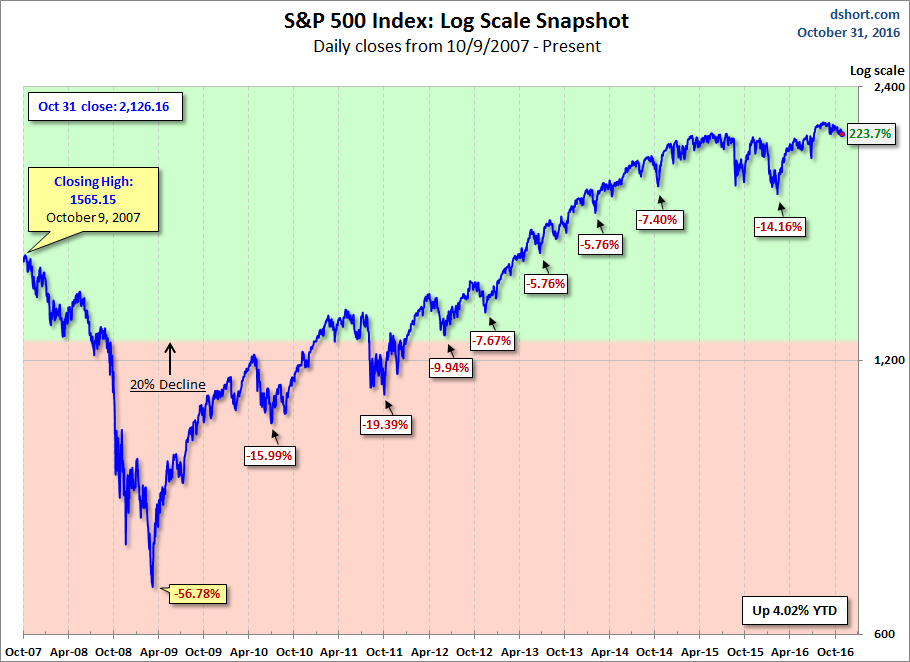
Here is a more conventional log-scale chart with drawdowns highlighted.
(Click on image to enlarge)
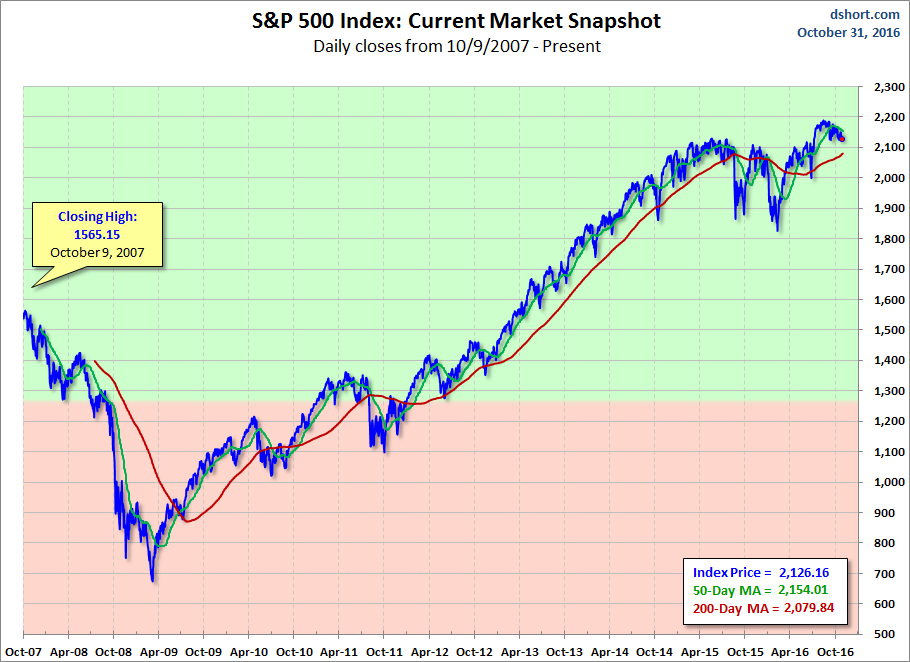
Here is a linear scale version of the same chart with the 50- and 200-day moving averages.
(Click on image to enlarge)
A Perspective on Volatility
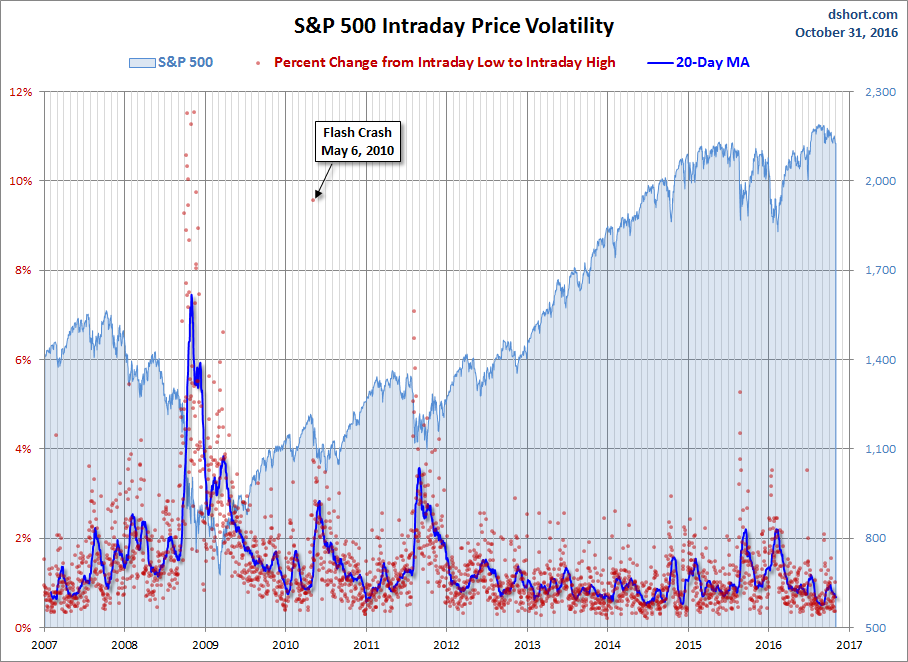
For a sense of the correlation between the closing price and intraday volatility, the chart below overlays the S&P 500 since 2007 with the intraday price range. We've also included a 20-day moving average to help identify trends in volatility.
(Click on image to enlarge)



Comments
Log in or sign up to join the conversation.