
Major equity markets around the globe were in sell-off mode today. Our benchmark S&P 500 posted a 0.65% loss, its seventh consecutive finish in the red. The last time that happened was in late November 2011, the seventh loss being the day after Thanksgiving. That November 2011 selloff was quite a bit steeper at -7.88%. Today's seven-day slump is a more modest 2.48%. Should the 500 extend its slump tomorrow to eight days, we'd have to look back to October 2008 for a duration equivalent. But the size of that selloff was a gut-wrenching -22.80%.
The VIX "fear gauge" hit an intraday high yesterday above the 20 benchmark. But it remained in the below 20 throughout today's trade and ended the session at 19.34.
The 10-year Note closed the session at 1.81%, down two BPs from the previous close.
Here is a snapshot of past five sessions in the S&P 500. Today's release of the FOMC Statement was a non-event. The fast trade took the index to its -0.84% intraday low followed by an immediate bounce back to the prior trading range.
(Click on image to enlarge)

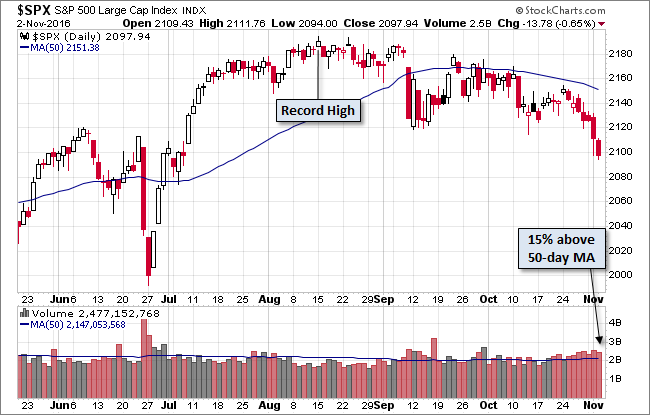
Here's a daily chart of the index. Volume has been slightly elevated during the selloff, but we're not seeing a big spike in volume such as we saw during the two-day plunge in late June.
(Click on image to enlarge)
A Perspective on Drawdowns
Here's a snapshot of selloffs since the 2009 trough.
(Click on image to enlarge)

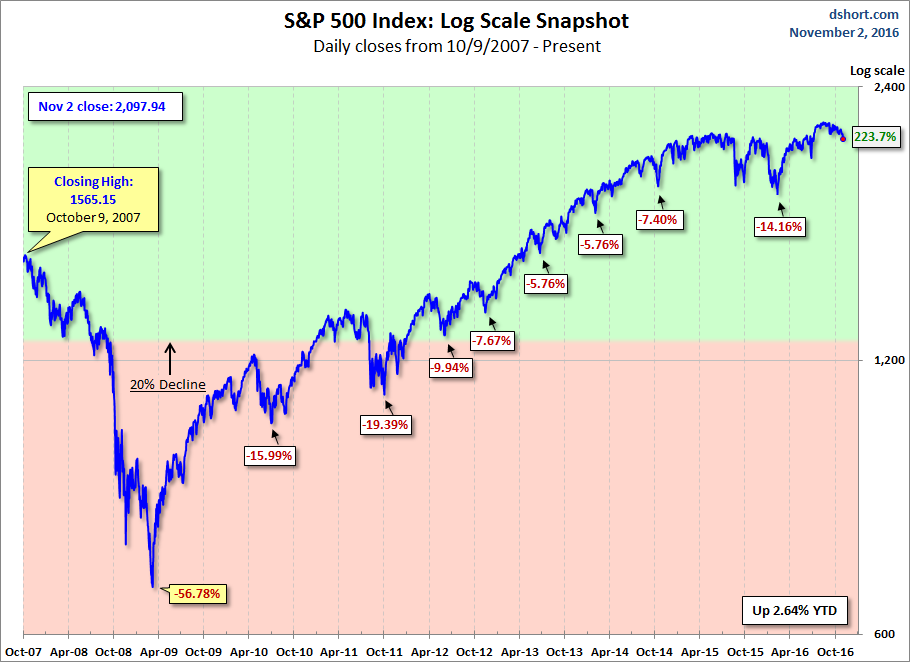
Here is a more conventional log-scale chart with drawdowns highlighted.
(Click on image to enlarge)
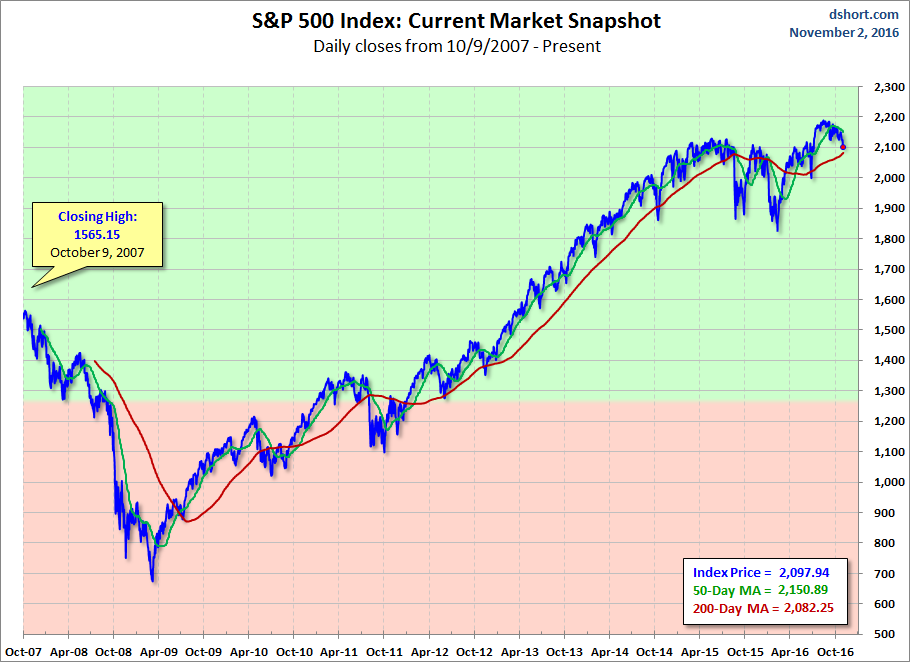
Here is a linear scale version of the same chart with the 50- and 200-day moving averages.
(Click on image to enlarge)
A Perspective on Volatility
For a sense of the correlation between the closing price and intraday volatility, the chart below overlays the S&P 500 since 2007 with the intraday price range. We've also included a 20-day moving average to help identify trends in volatility.
(Click on image to enlarge)


Comments
Log in or sign up to join the conversation.