
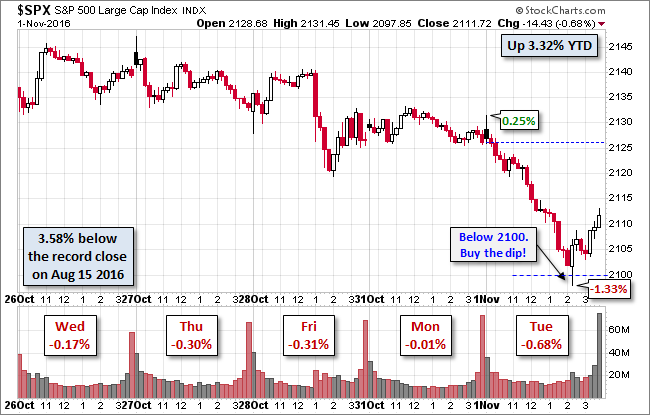
Today major equity indexes in Asia posted gains, but their Europe and US counterparts finished the session uniformly in the red. Yesterday's loss for our benchmark S&P 500 was its sixth consecutive decline ... something that hasn't happened since August of last year. The index hit its 0.25% intraday high shortly after the open and sold off to its -1.33% mid-afternoon low, at which point a "buy-the-dip" strategy halved the loss to -0.68% at the close. About that "buy-the-dip" strategy: It was no doubt triggered by the S&P 500 dropping below the 2100 level, a situation that lasted for about eight minutes.
The 10-year closed the session at 1.83%, down one BP from the previous close. Here is a snapshot of past five sessions in the S&P 500.
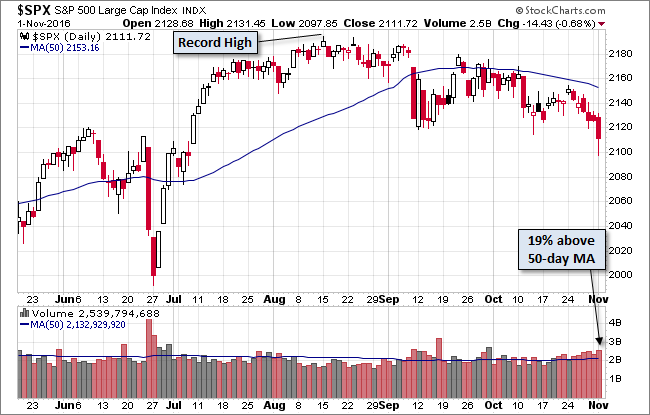
Here's a daily chart of the index. A preliminary read on volume showed an increase to 19% above its 50-day moving average.
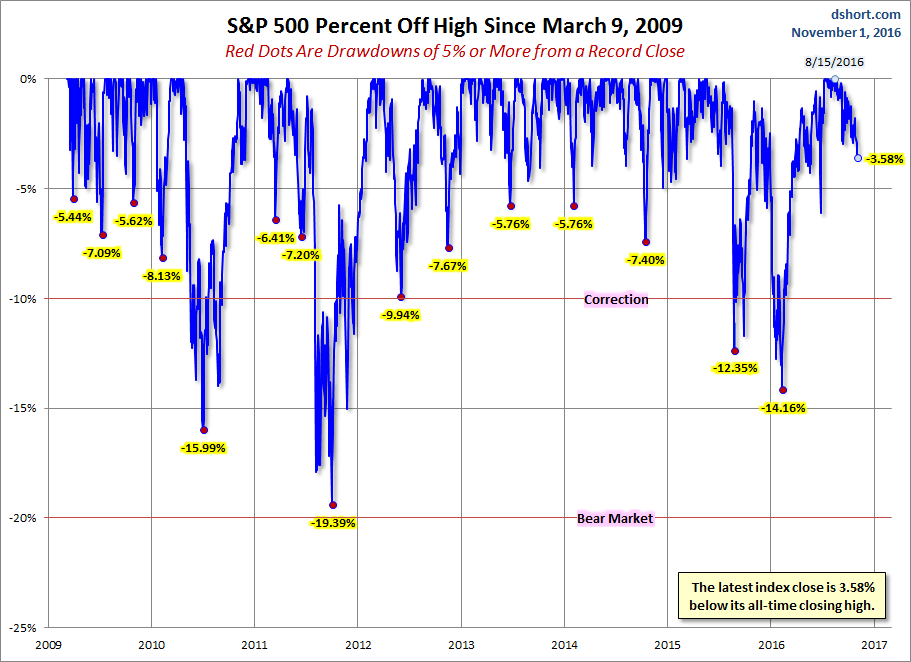
A Perspective on Drawdowns
Here's a snapshot of selloffs since the 2009 trough.
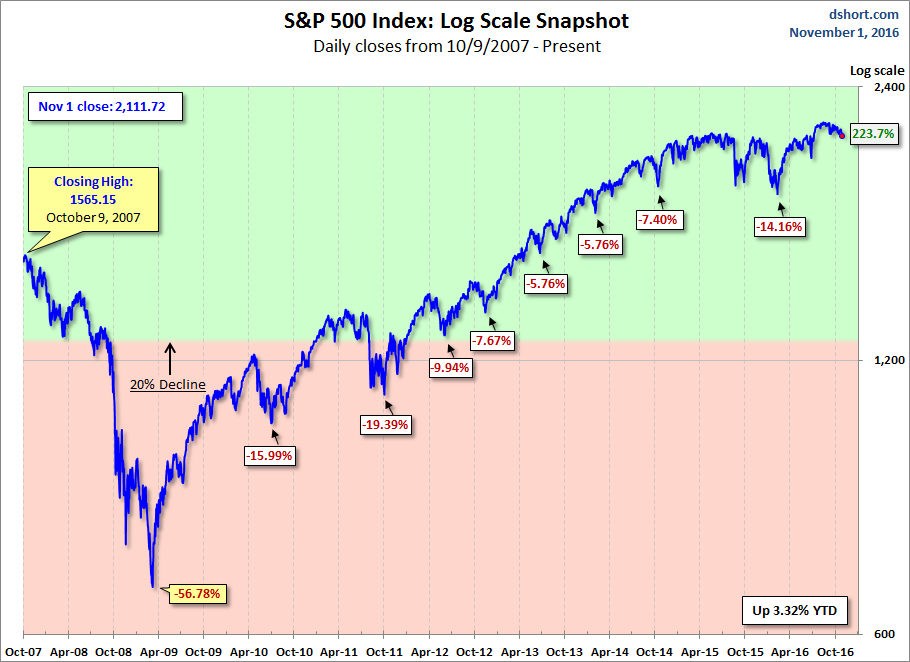
Here is a more conventional log-scale chart with drawdowns highlighted.
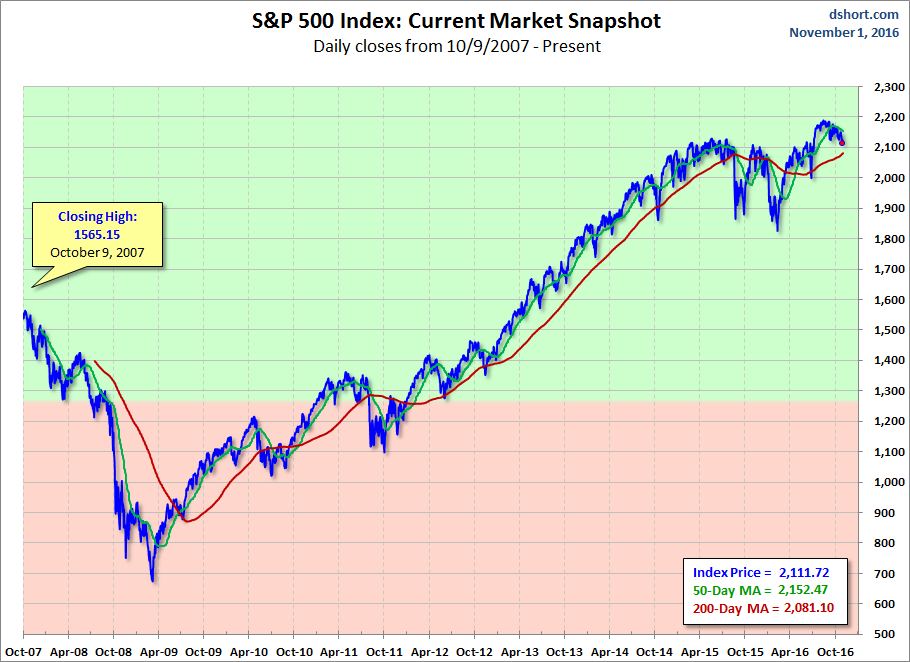
Here is a linear scale version of the same chart with the 50- and 200-day moving averages.
A Perspective on Volatility
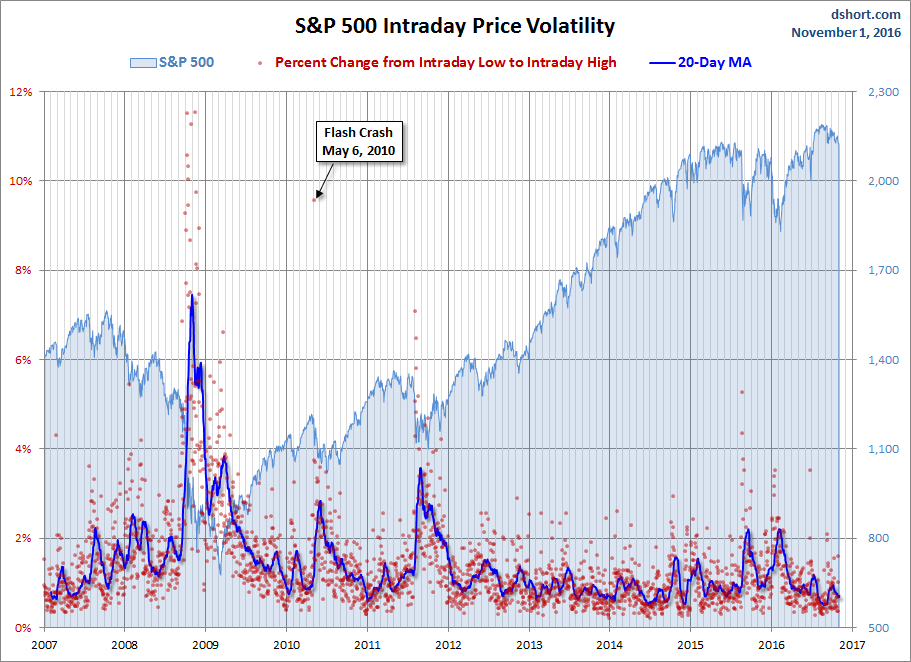
For a sense of the correlation between the closing price and intraday volatility, the chart below overlays the S&P 500 since 2007 with the intraday price range. We've also included a 20-day moving average to help identify trends in volatility.


Comments
Log in or sign up to join the conversation.