

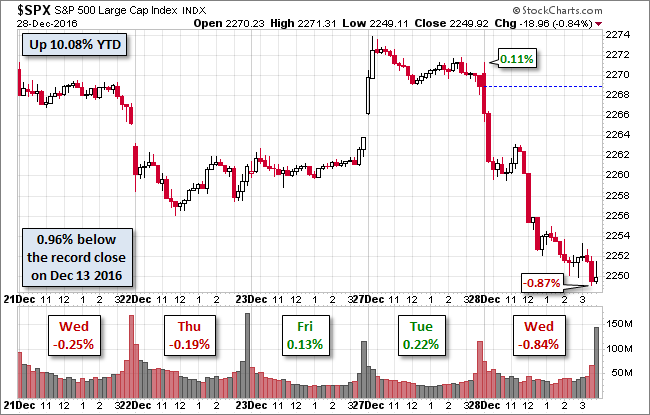
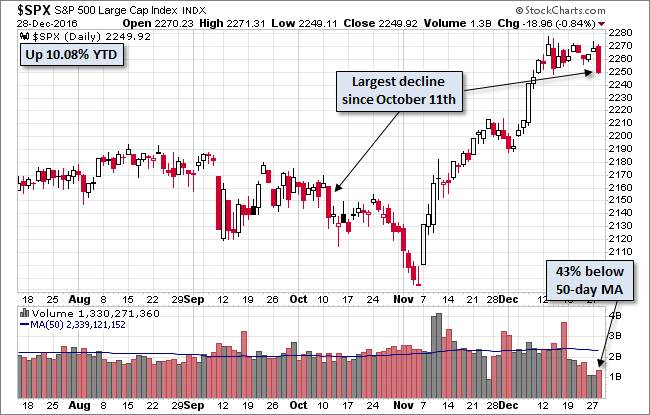
The S&P 500 hit its 0.11% intraday high in the second minute of trading and then sold off sharply to its mid-morning low. A second sharp sell-off began around lunchtime, followed by a slower trend downward to the -0.84% loss, just a few ticks above the -0.87% intraday low about 15 minutes before the bell. Today's sell-off was the largest since the 1.24% drop on October 11th, 54 sessions ago.
Here is a snapshot of the past five sessions.
(Click on image to enlarge)
The yield on the 10-year note closed at 2.51%, down six BPs from its previous close and the lowest close in ten sessions.
Here is daily chart of the index. The trading ticked up slightly from the past two sessions, but volume remains at light, year-end holiday levels.
(Click on image to enlarge)
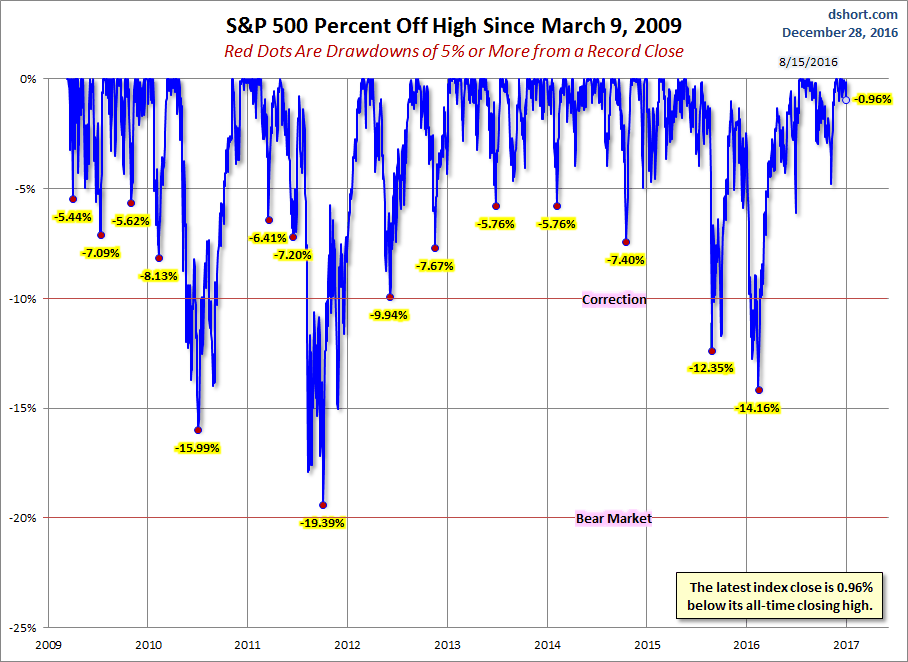
Perspective on Drawdowns
Here's a snapshot of selloffs since the 2009 trough.
(Click on image to enlarge)
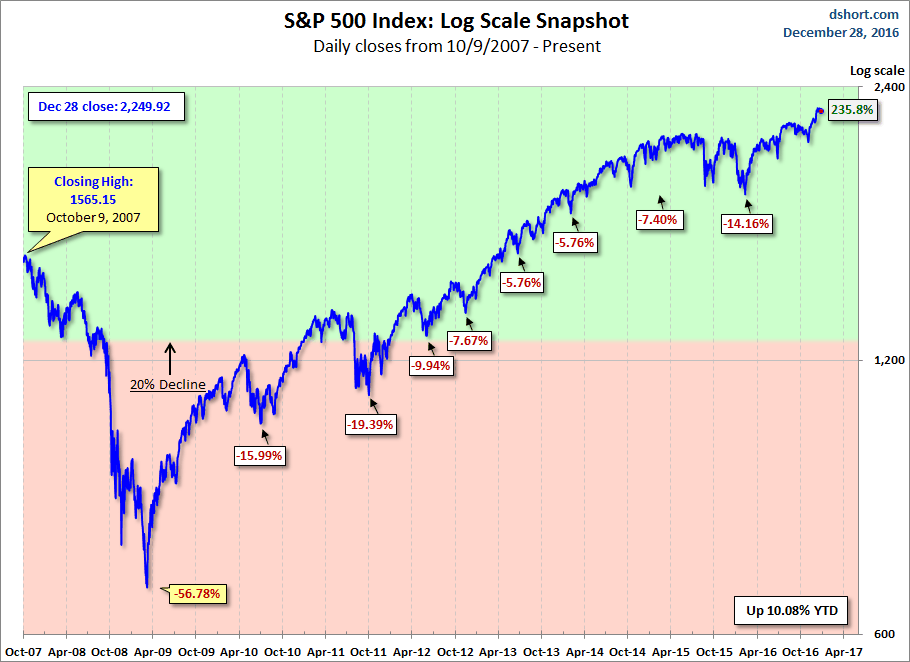
Here is a more conventional log-scale chart with drawdowns highlighted.
(Click on image to enlarge)
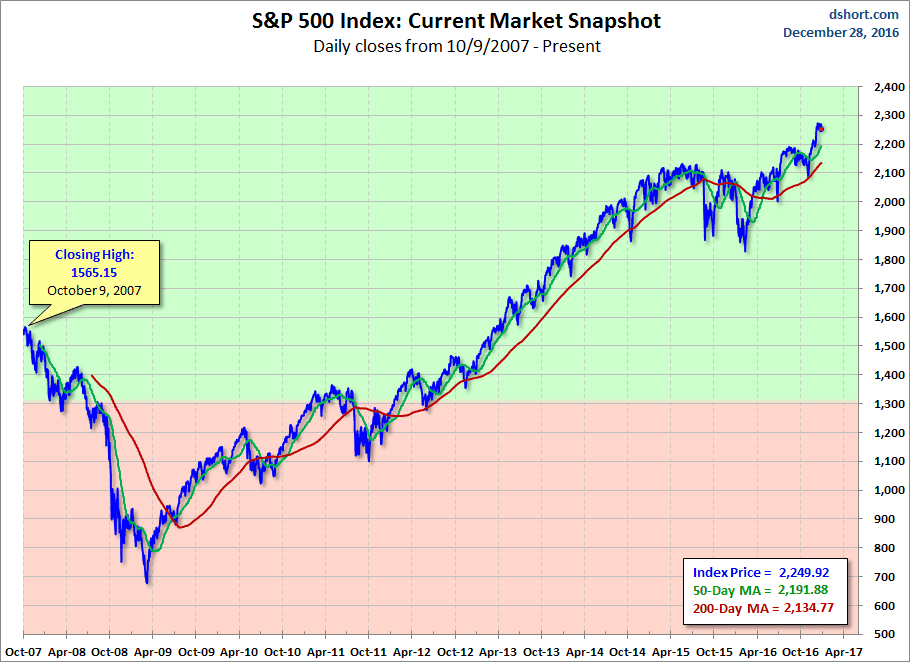
Here is a linear scale version of the same chart with the 50- and 200-day moving averages.
(Click on image to enlarge)
A Perspective on Volatility
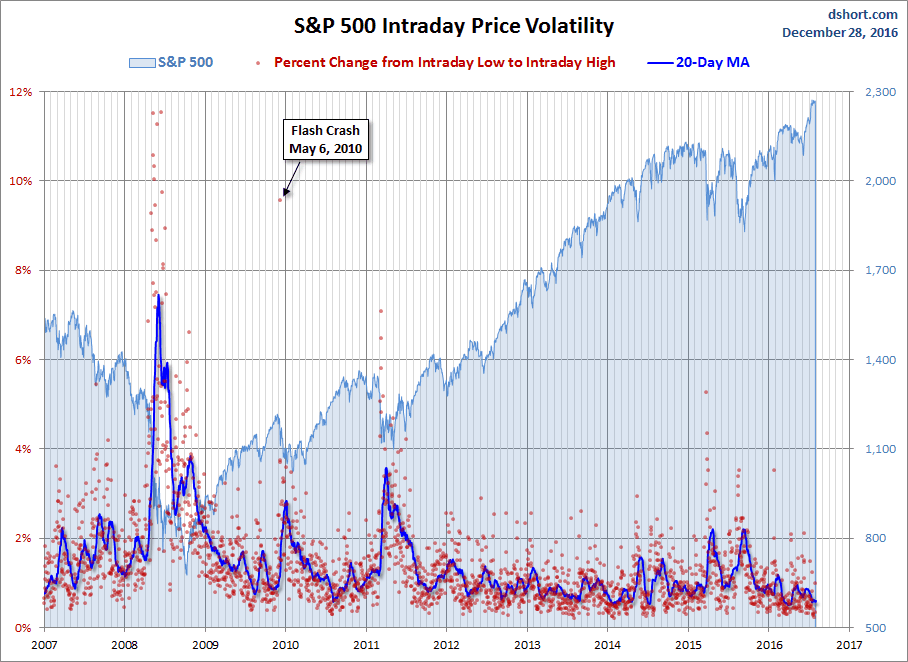
For a sense of the correlation between the closing price and intraday volatility, the chart below overlays the S&P 500 since 2007 with the intraday price range. We've also included a 20-day moving average to help identify trends in volatility.
(Click on image to enlarge)



Comments
Log in or sign up to join the conversation.