

How do you title a financial blog post summarizing the (in)action of a major equity index? Today the Dow rose a fractional 0.1%. Our counterparts at CNBC exclaim "Dow closes at highest since July; financials post 5-day win streak." Our take on today's trade in the S&P 500 is less enthusiastic. Of course the 500 posted an even smaller gain of only 0.02%. We call it a zombie trade — a flat finish to the narrowest intraday range (-0.21% to 0.26%) so far this year.
The yield on the 10-year note closed at 1.80%, up three basis points from the previous close.
Here is a snapshot of past five sessions in the S&P 500.

Here is a daily chart of the SPY ETF, which gives us a better sense of participation than the underlying index. It closed the session with an even smaller gain, a microscopic 0.01 point (not percent). And the SPY volume was the lowest since the abbreviated Christmas Eve session of last year. A glance at the trading volume since the February low is evidence of the pervading air of caution in the investment community.

A Perspective on Drawdowns
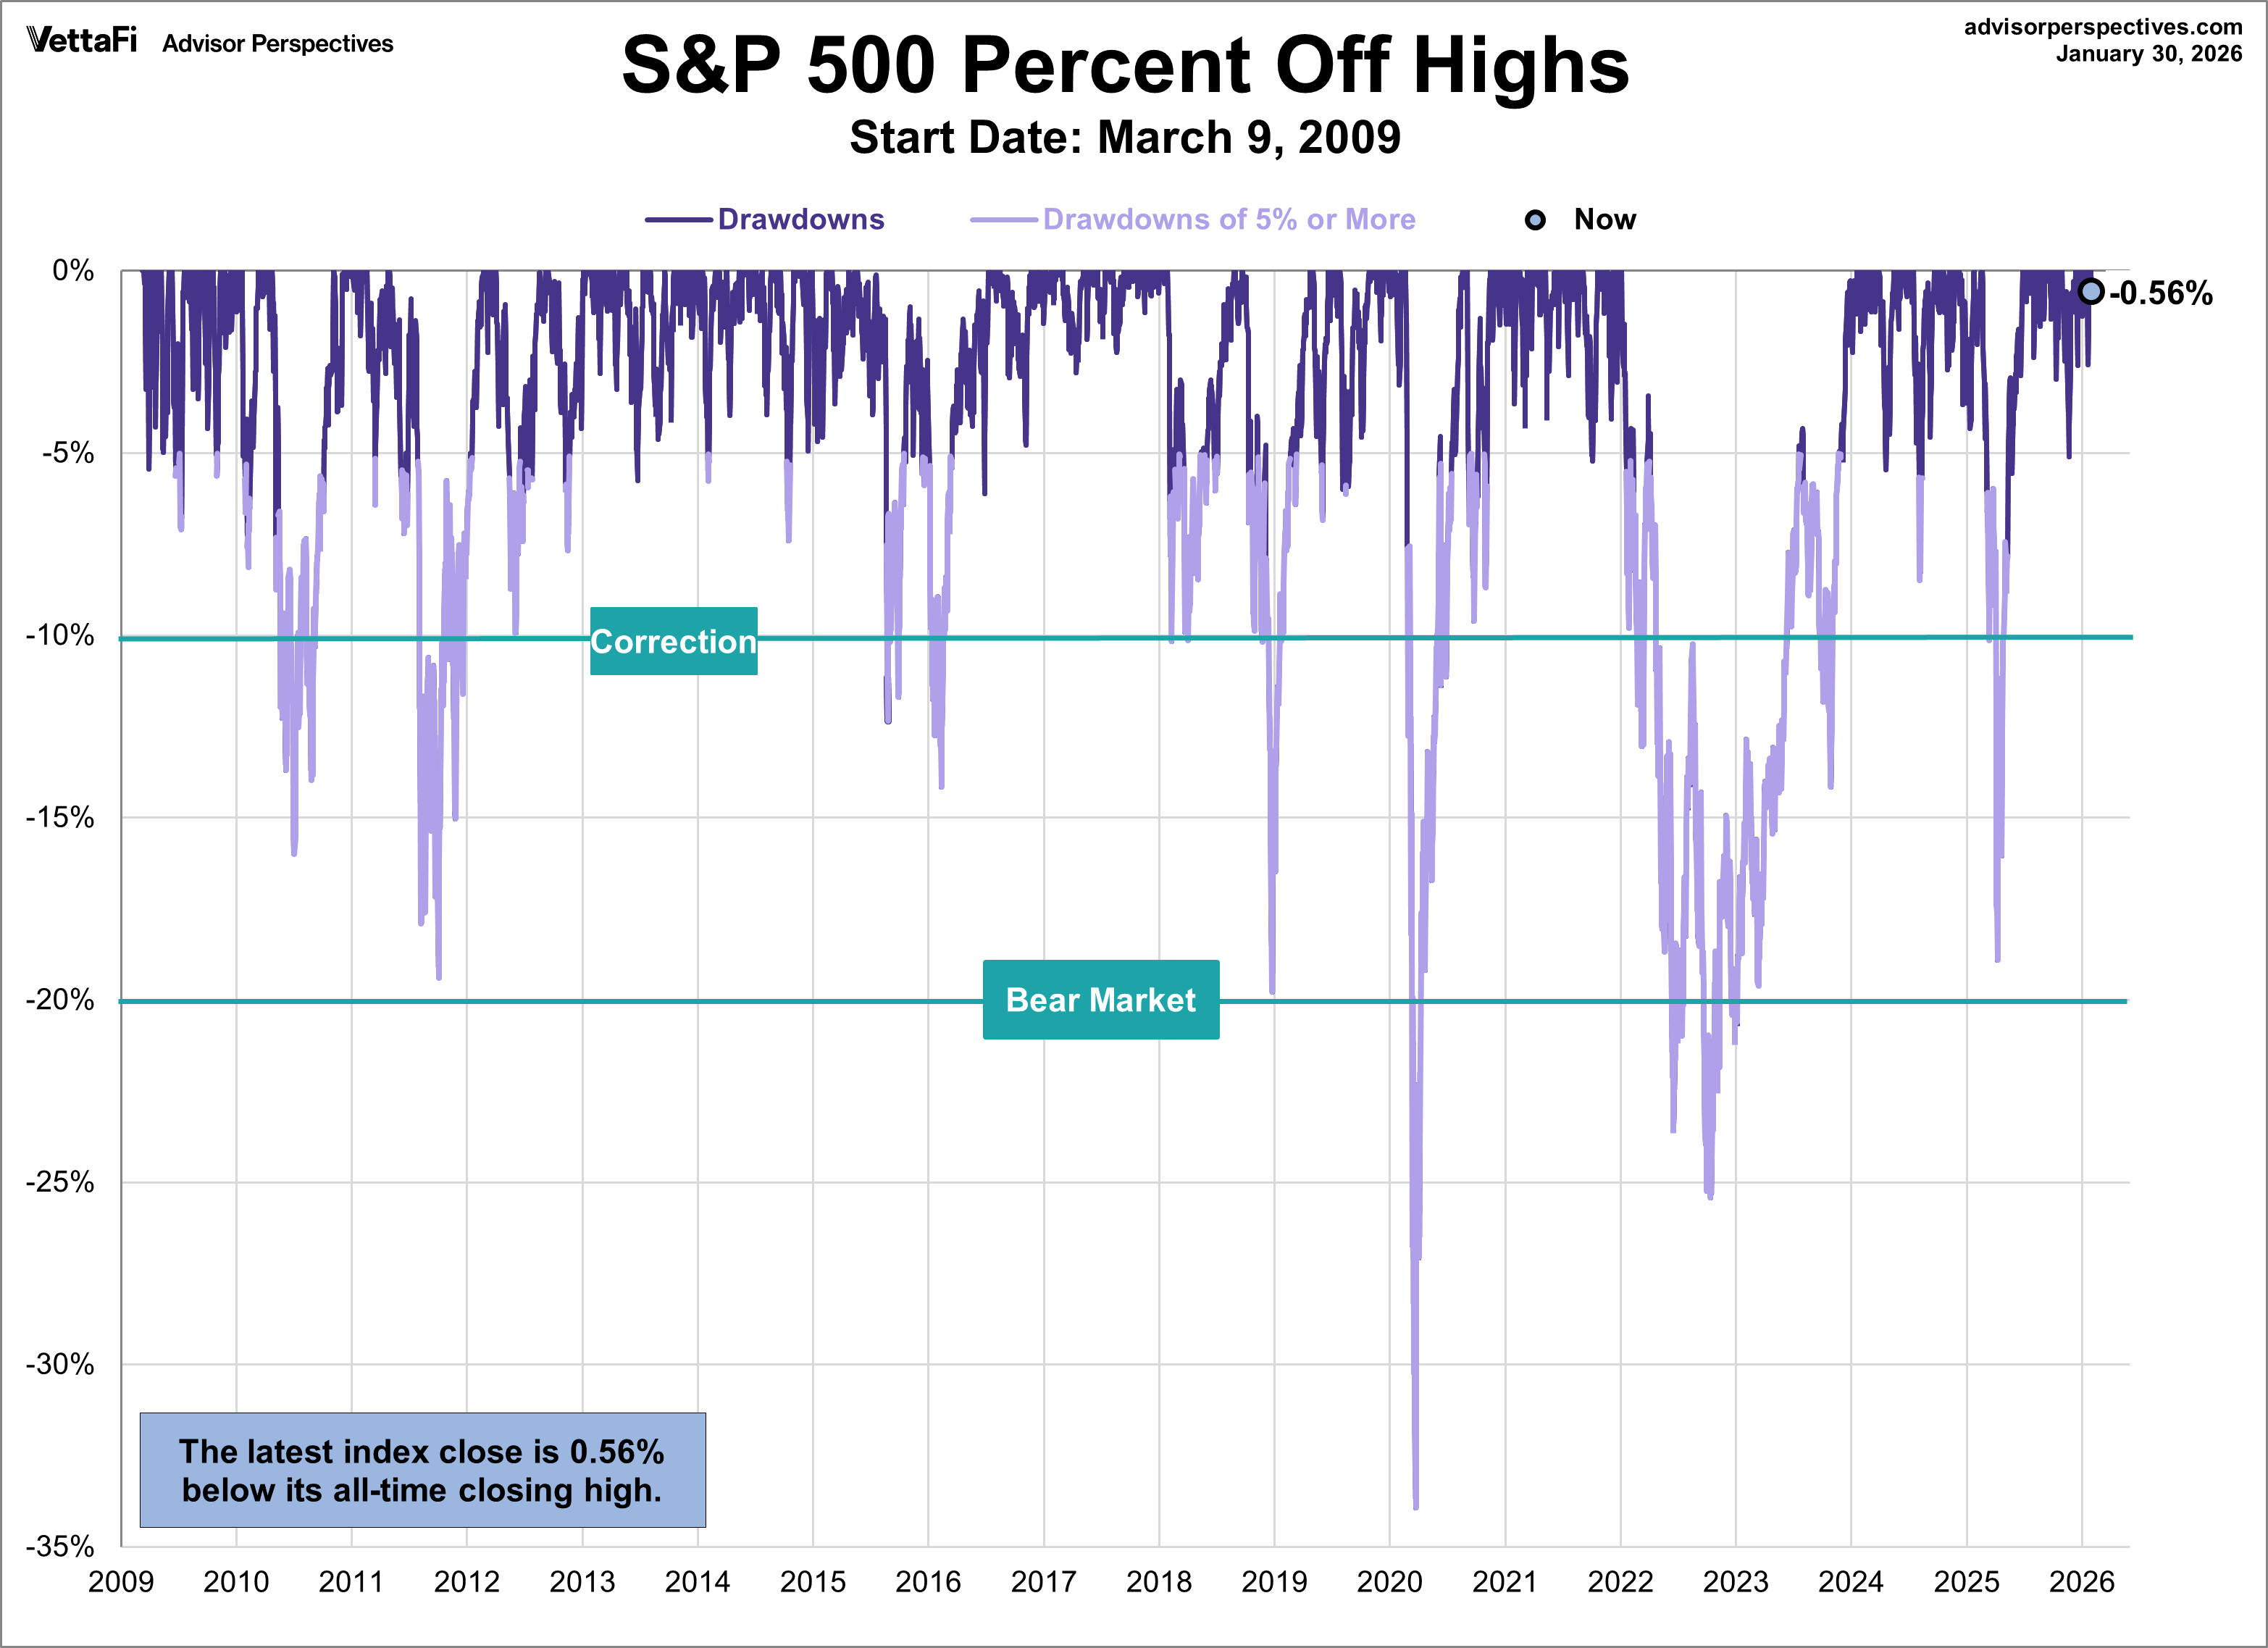
Here's a snapshot of selloffs since the 2009 trough.
Here is a more conventional log-scale chart with drawdowns highlighted.
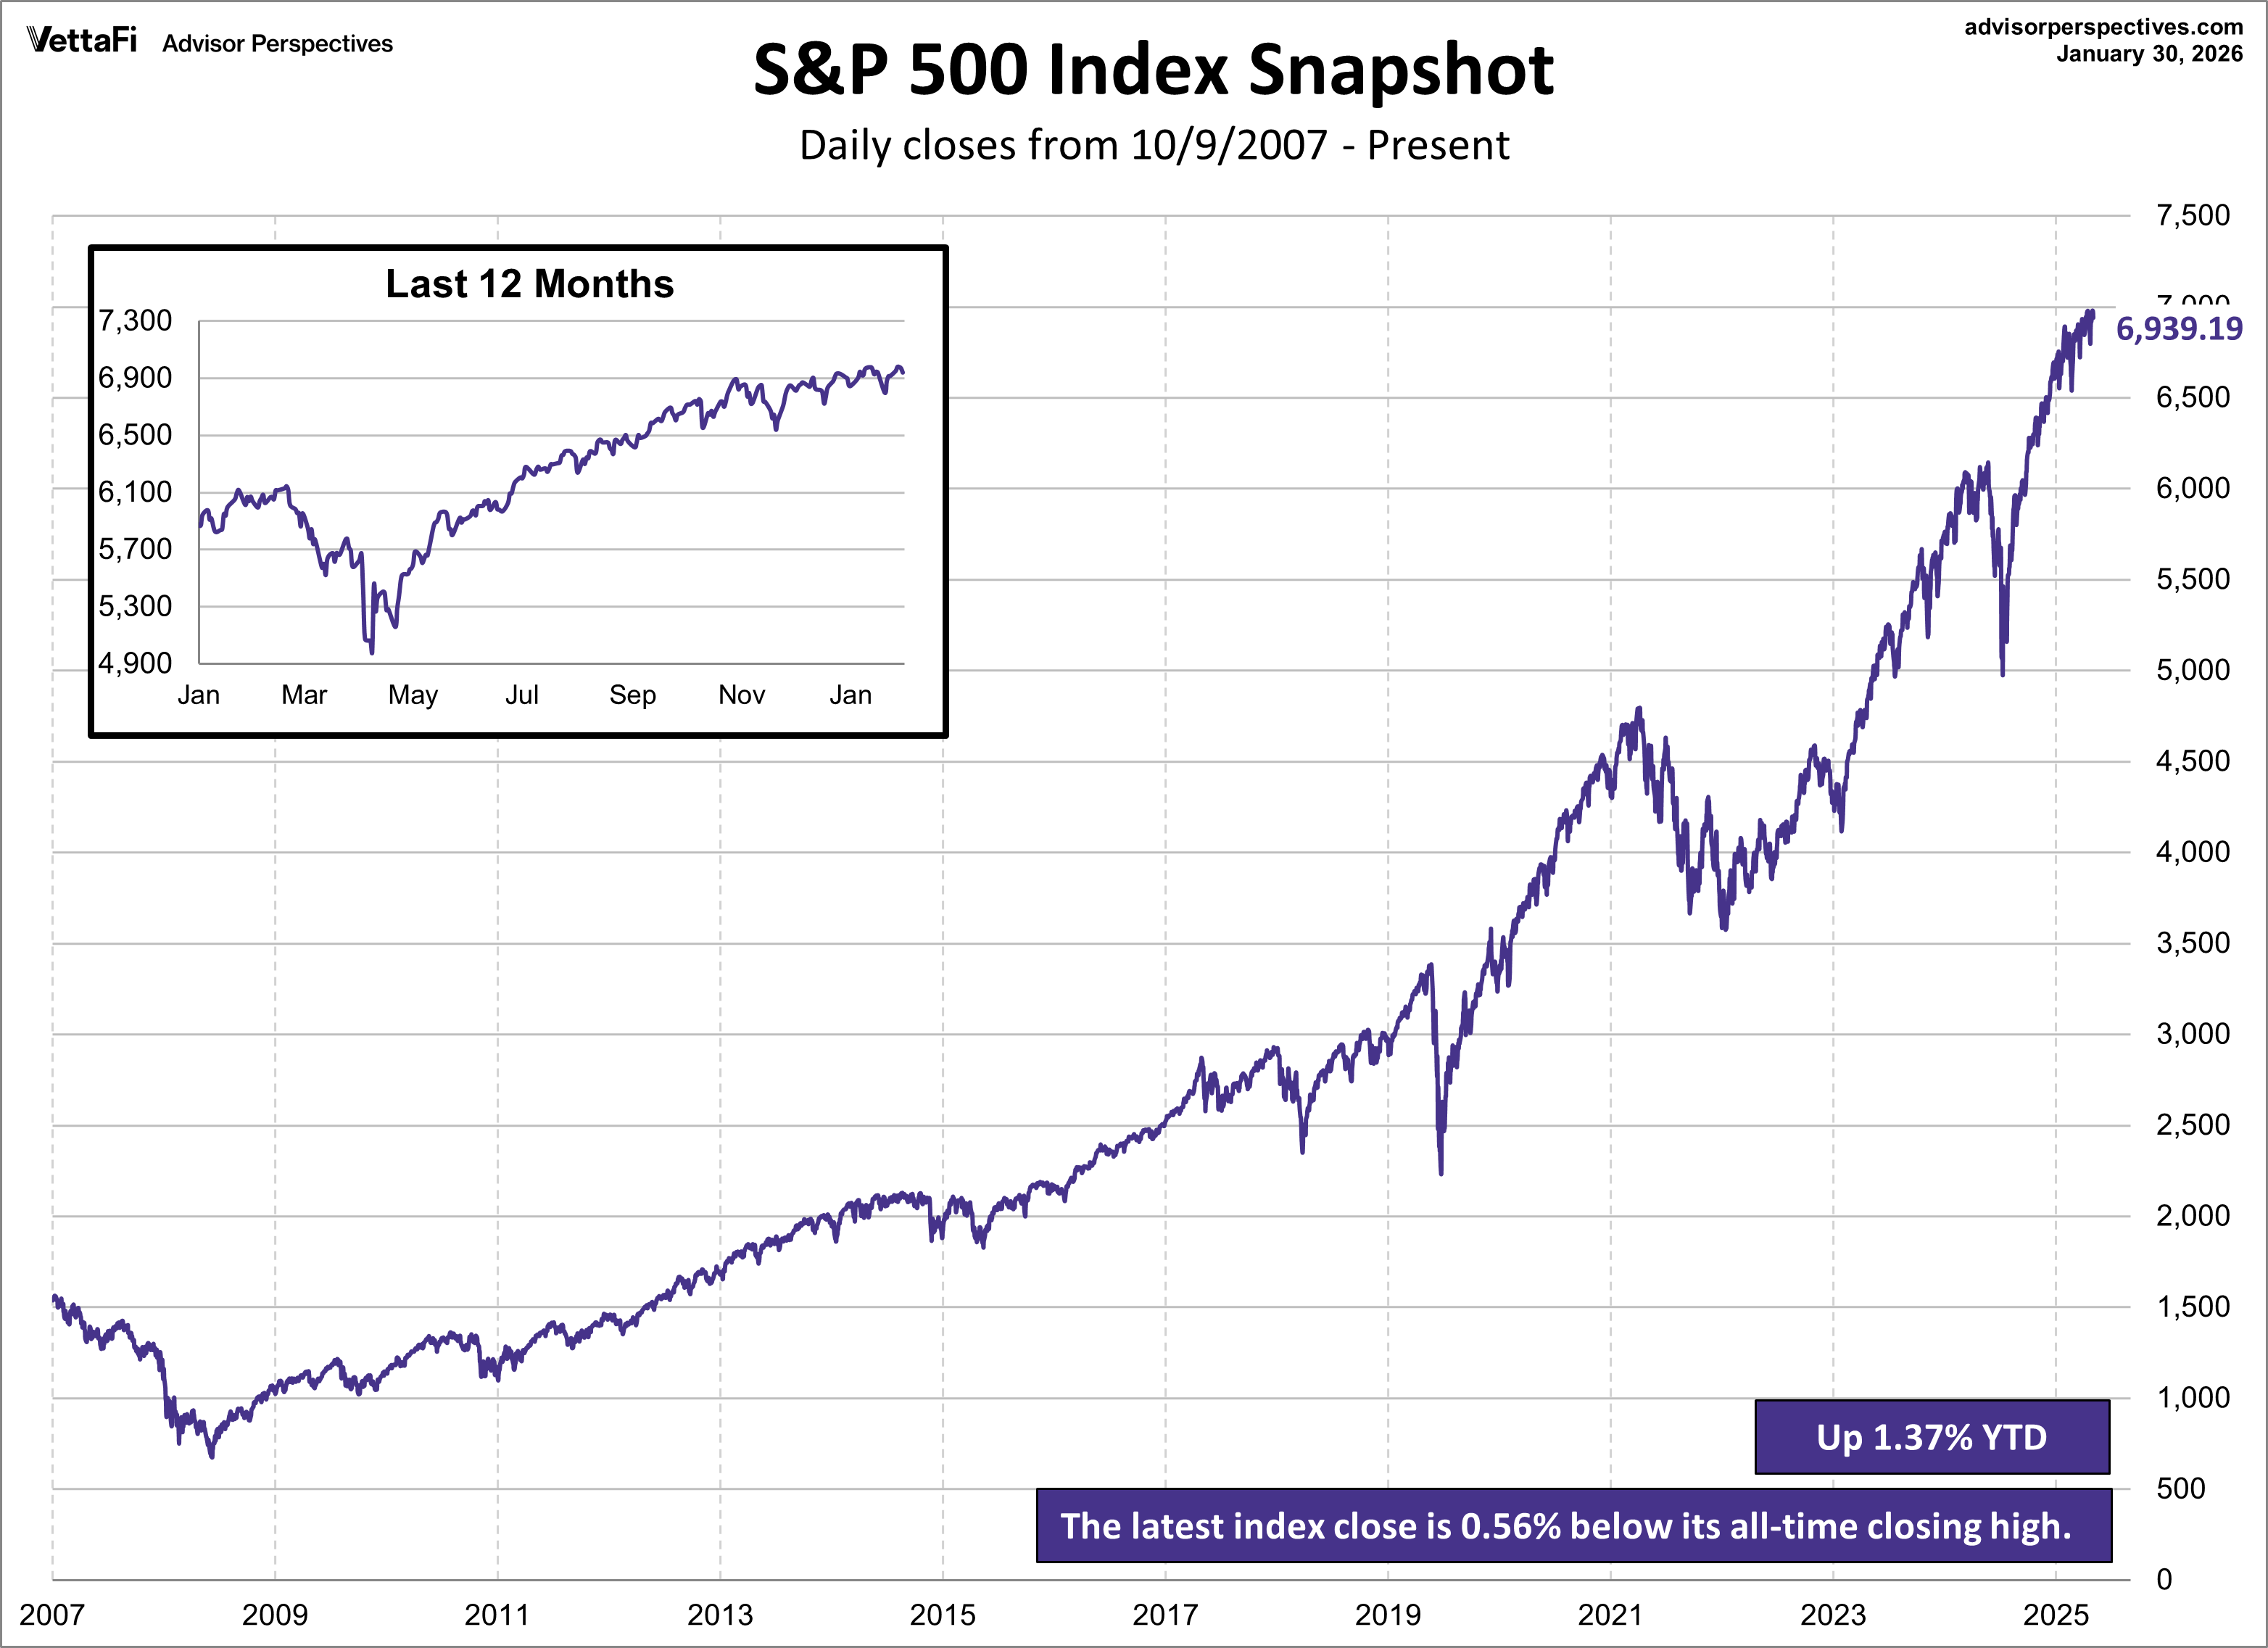
Here is a linear scale version of the same chart with the 50- and 200-day moving averages.

A Perspective on Volatility
For a sense of the correlation between the closing price and intraday volatility, the chart below overlays the S&P 500 since 2007 with the intraday price range. We've also included a 20-day moving average to help identify trends in volatility.




Comments
Log in or sign up to join the conversation.