
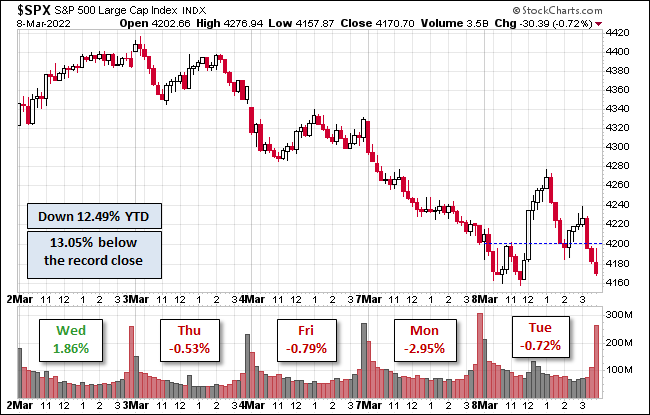
The S&P 500 fell into correction territory this week, dropping another 0.72% from yesterday. The index reacted to a barrage of news including the war in Ukraine and the subsequent energy price fluctuations. It is down 12.5% YTD and is 13% below its record close.
The U.S. Treasury puts the closing yield on the 10-year note as of March 8 at 1.86% which is above its record low (0.52% on 8/4/2020). The 2-year note is at 1.63%.
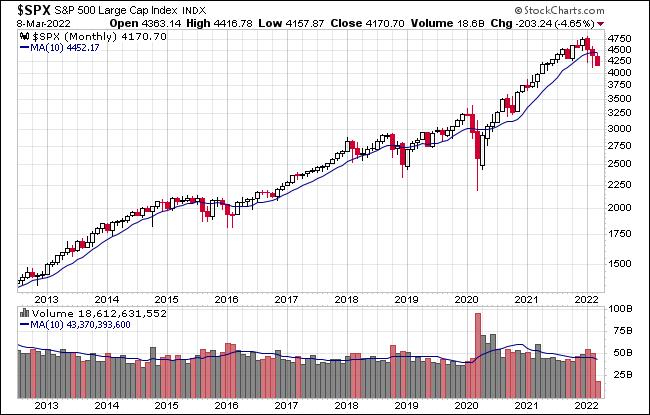
Here's a snapshot of the index going back to 2012.
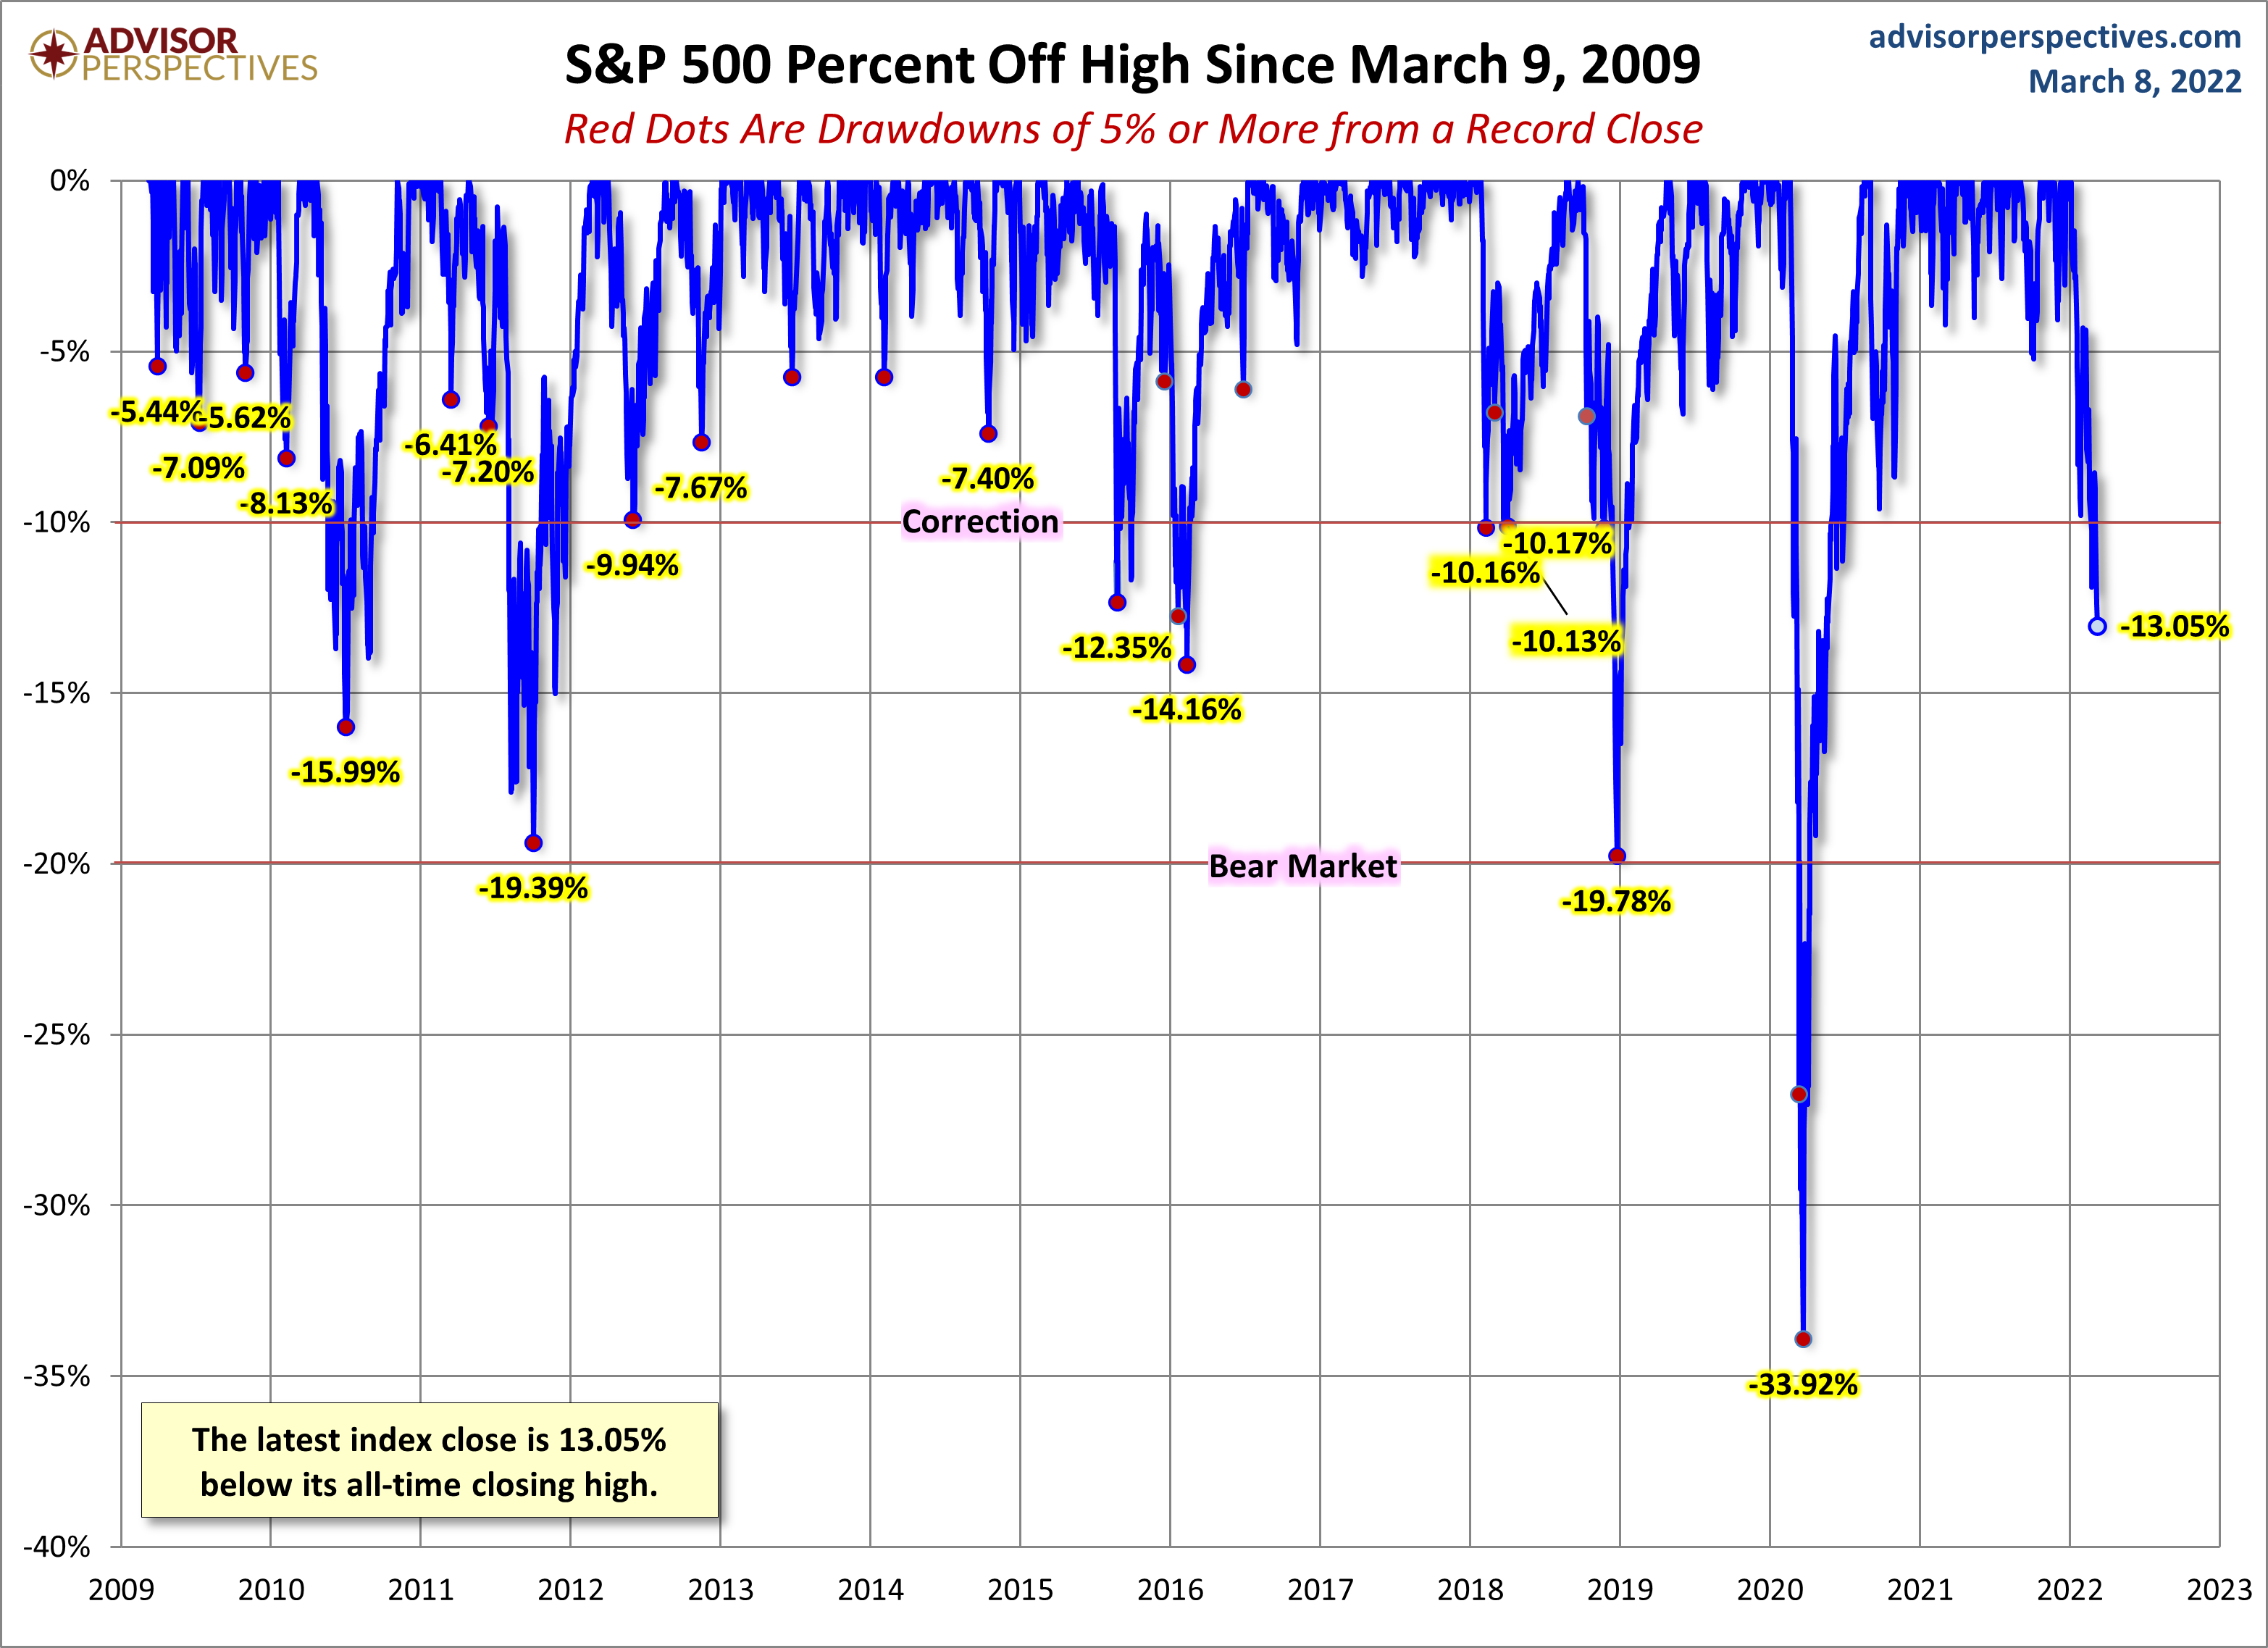
A Perspective on Drawdowns
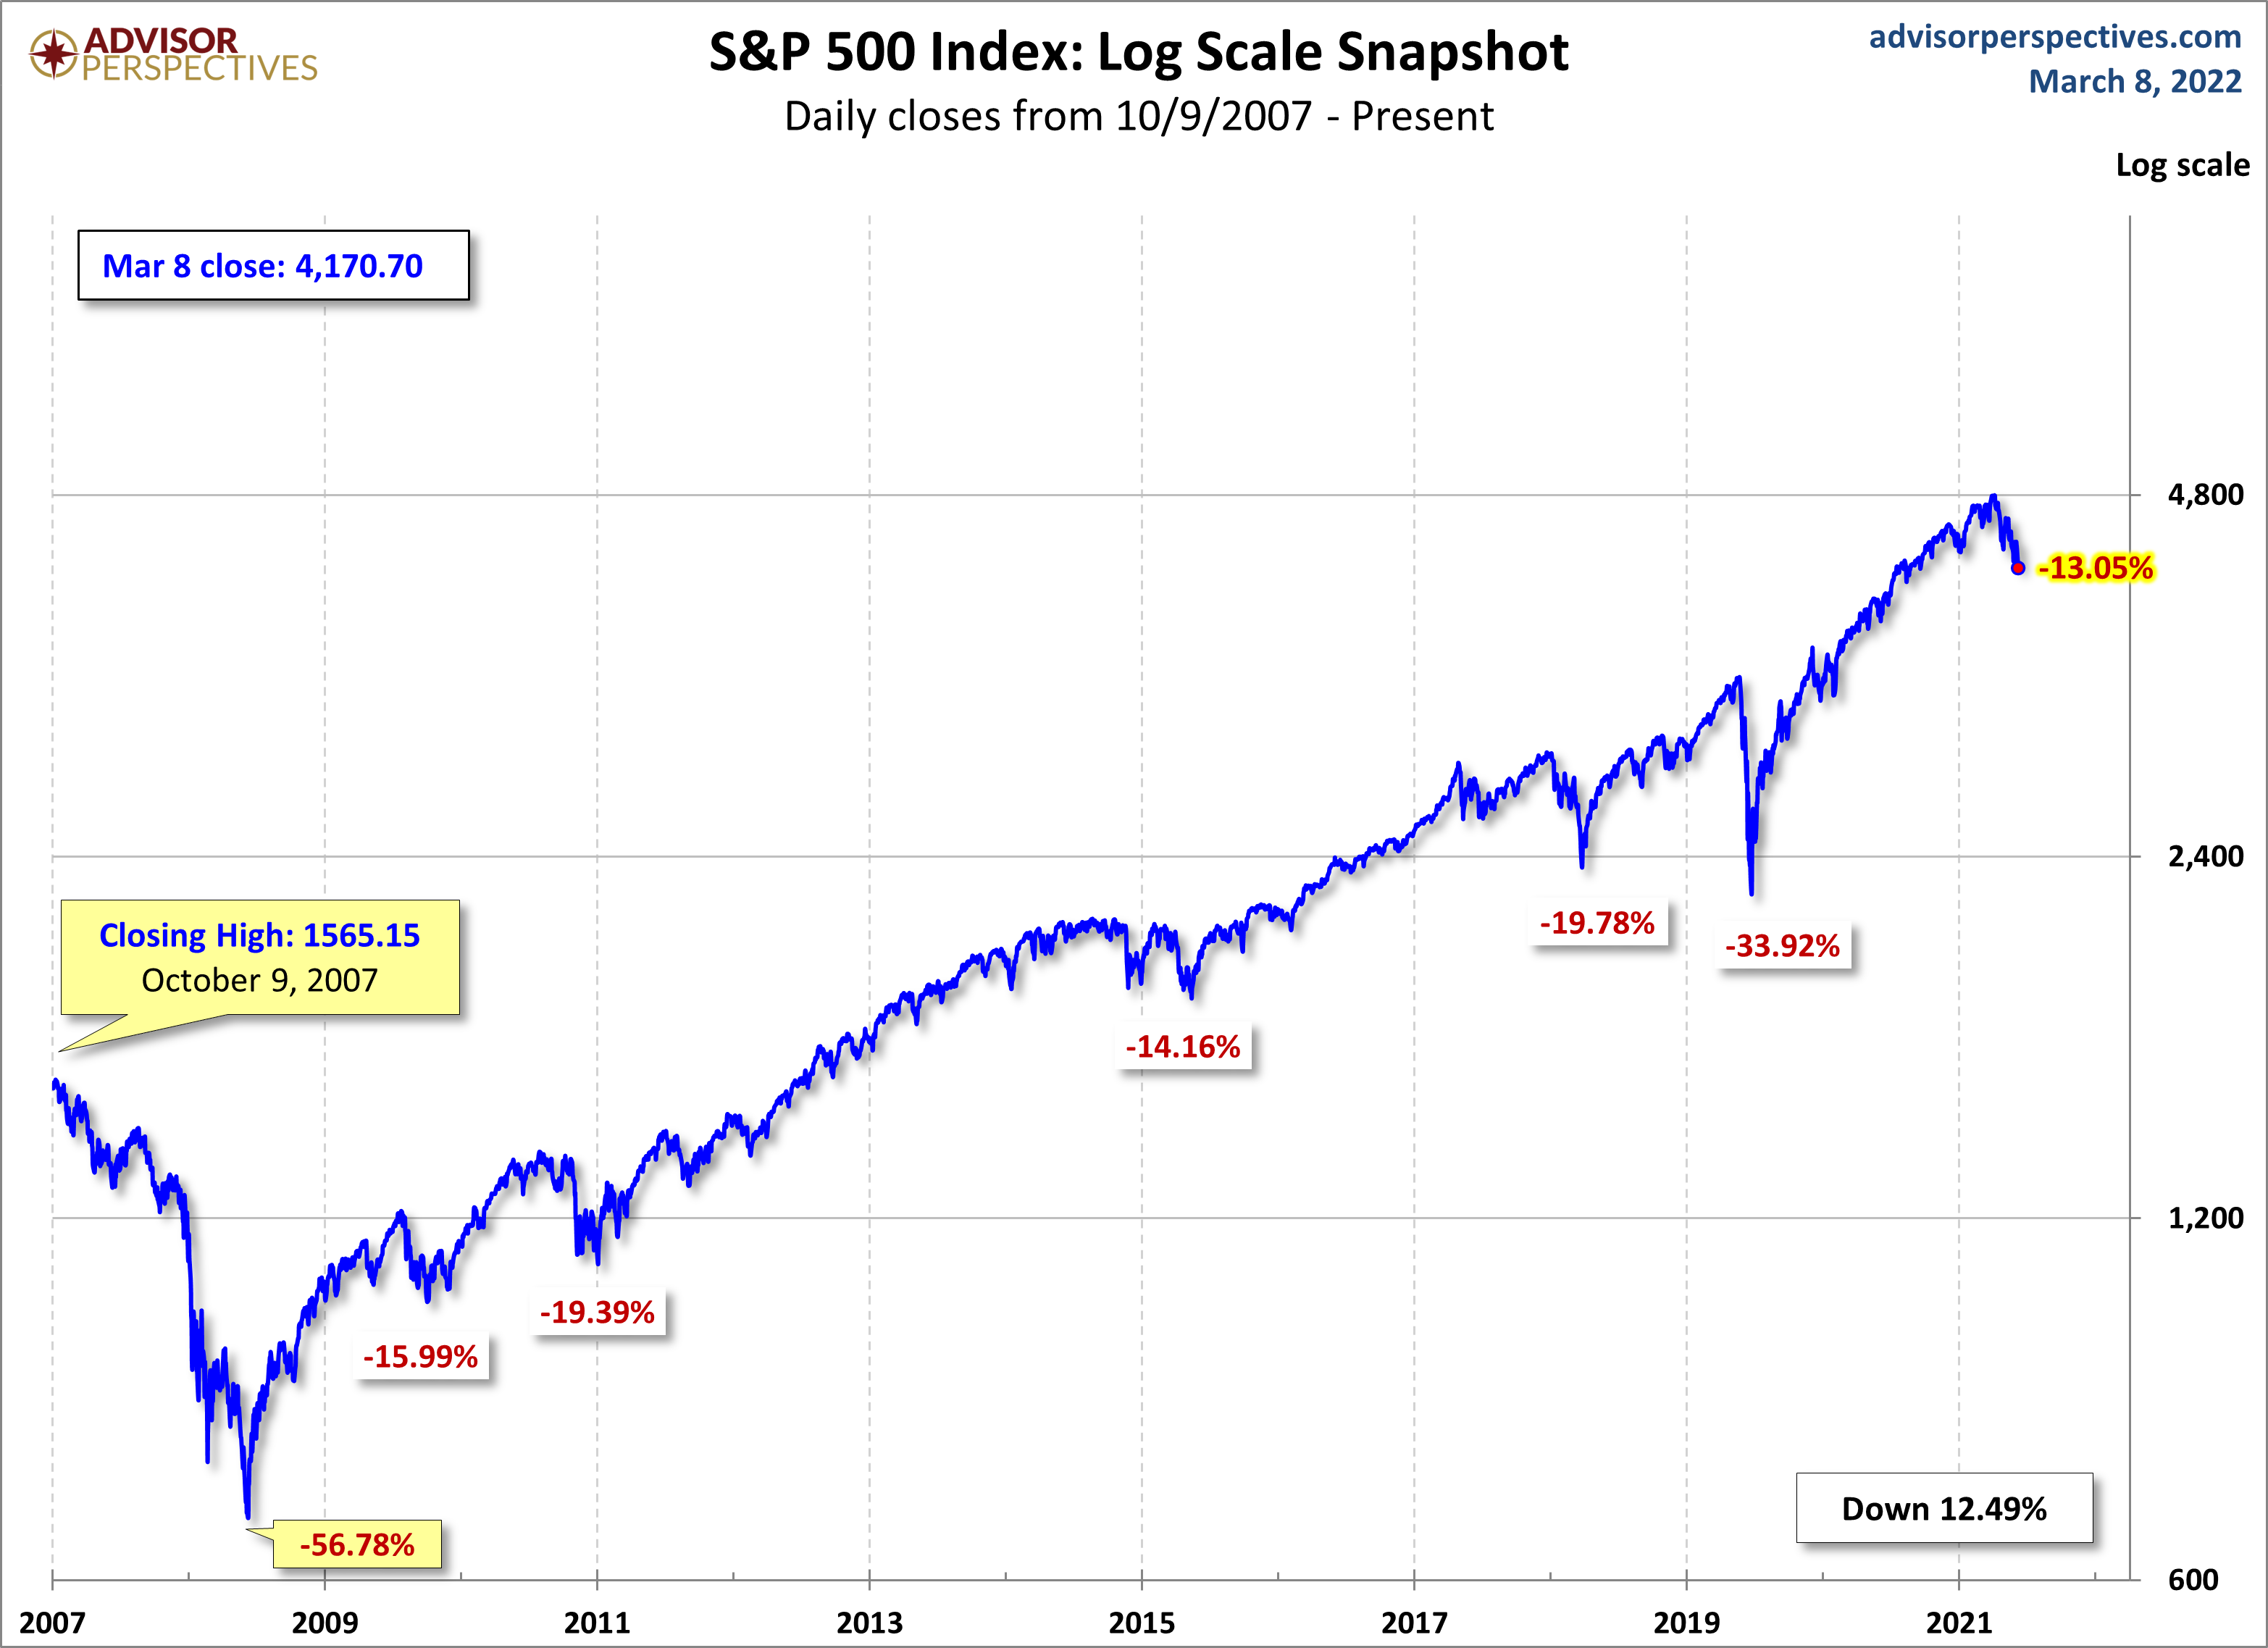
Here's a snapshot of record highs and selloffs since the 2009 trough.
(Click on image to enlarge)
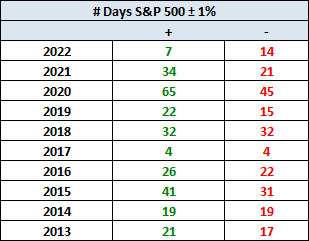
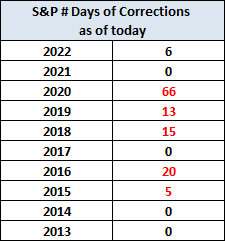
Here's a table with the number of days of a 1% or more change in either direction and the number of days of corrections (down 10% or more from the record high) going back to 2013.
Here is a more conventional log-scale chart with drawdowns highlighted.
(Click on image to enlarge)
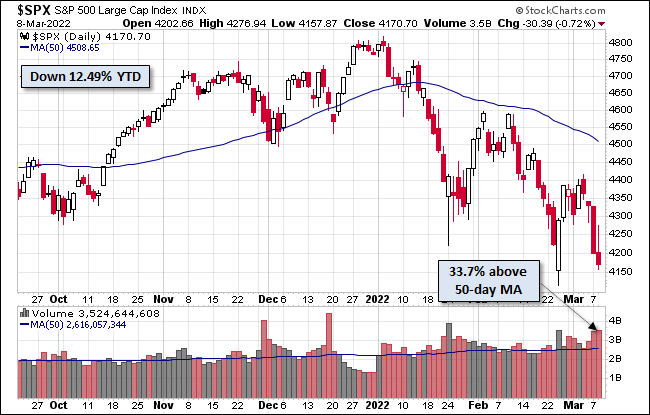
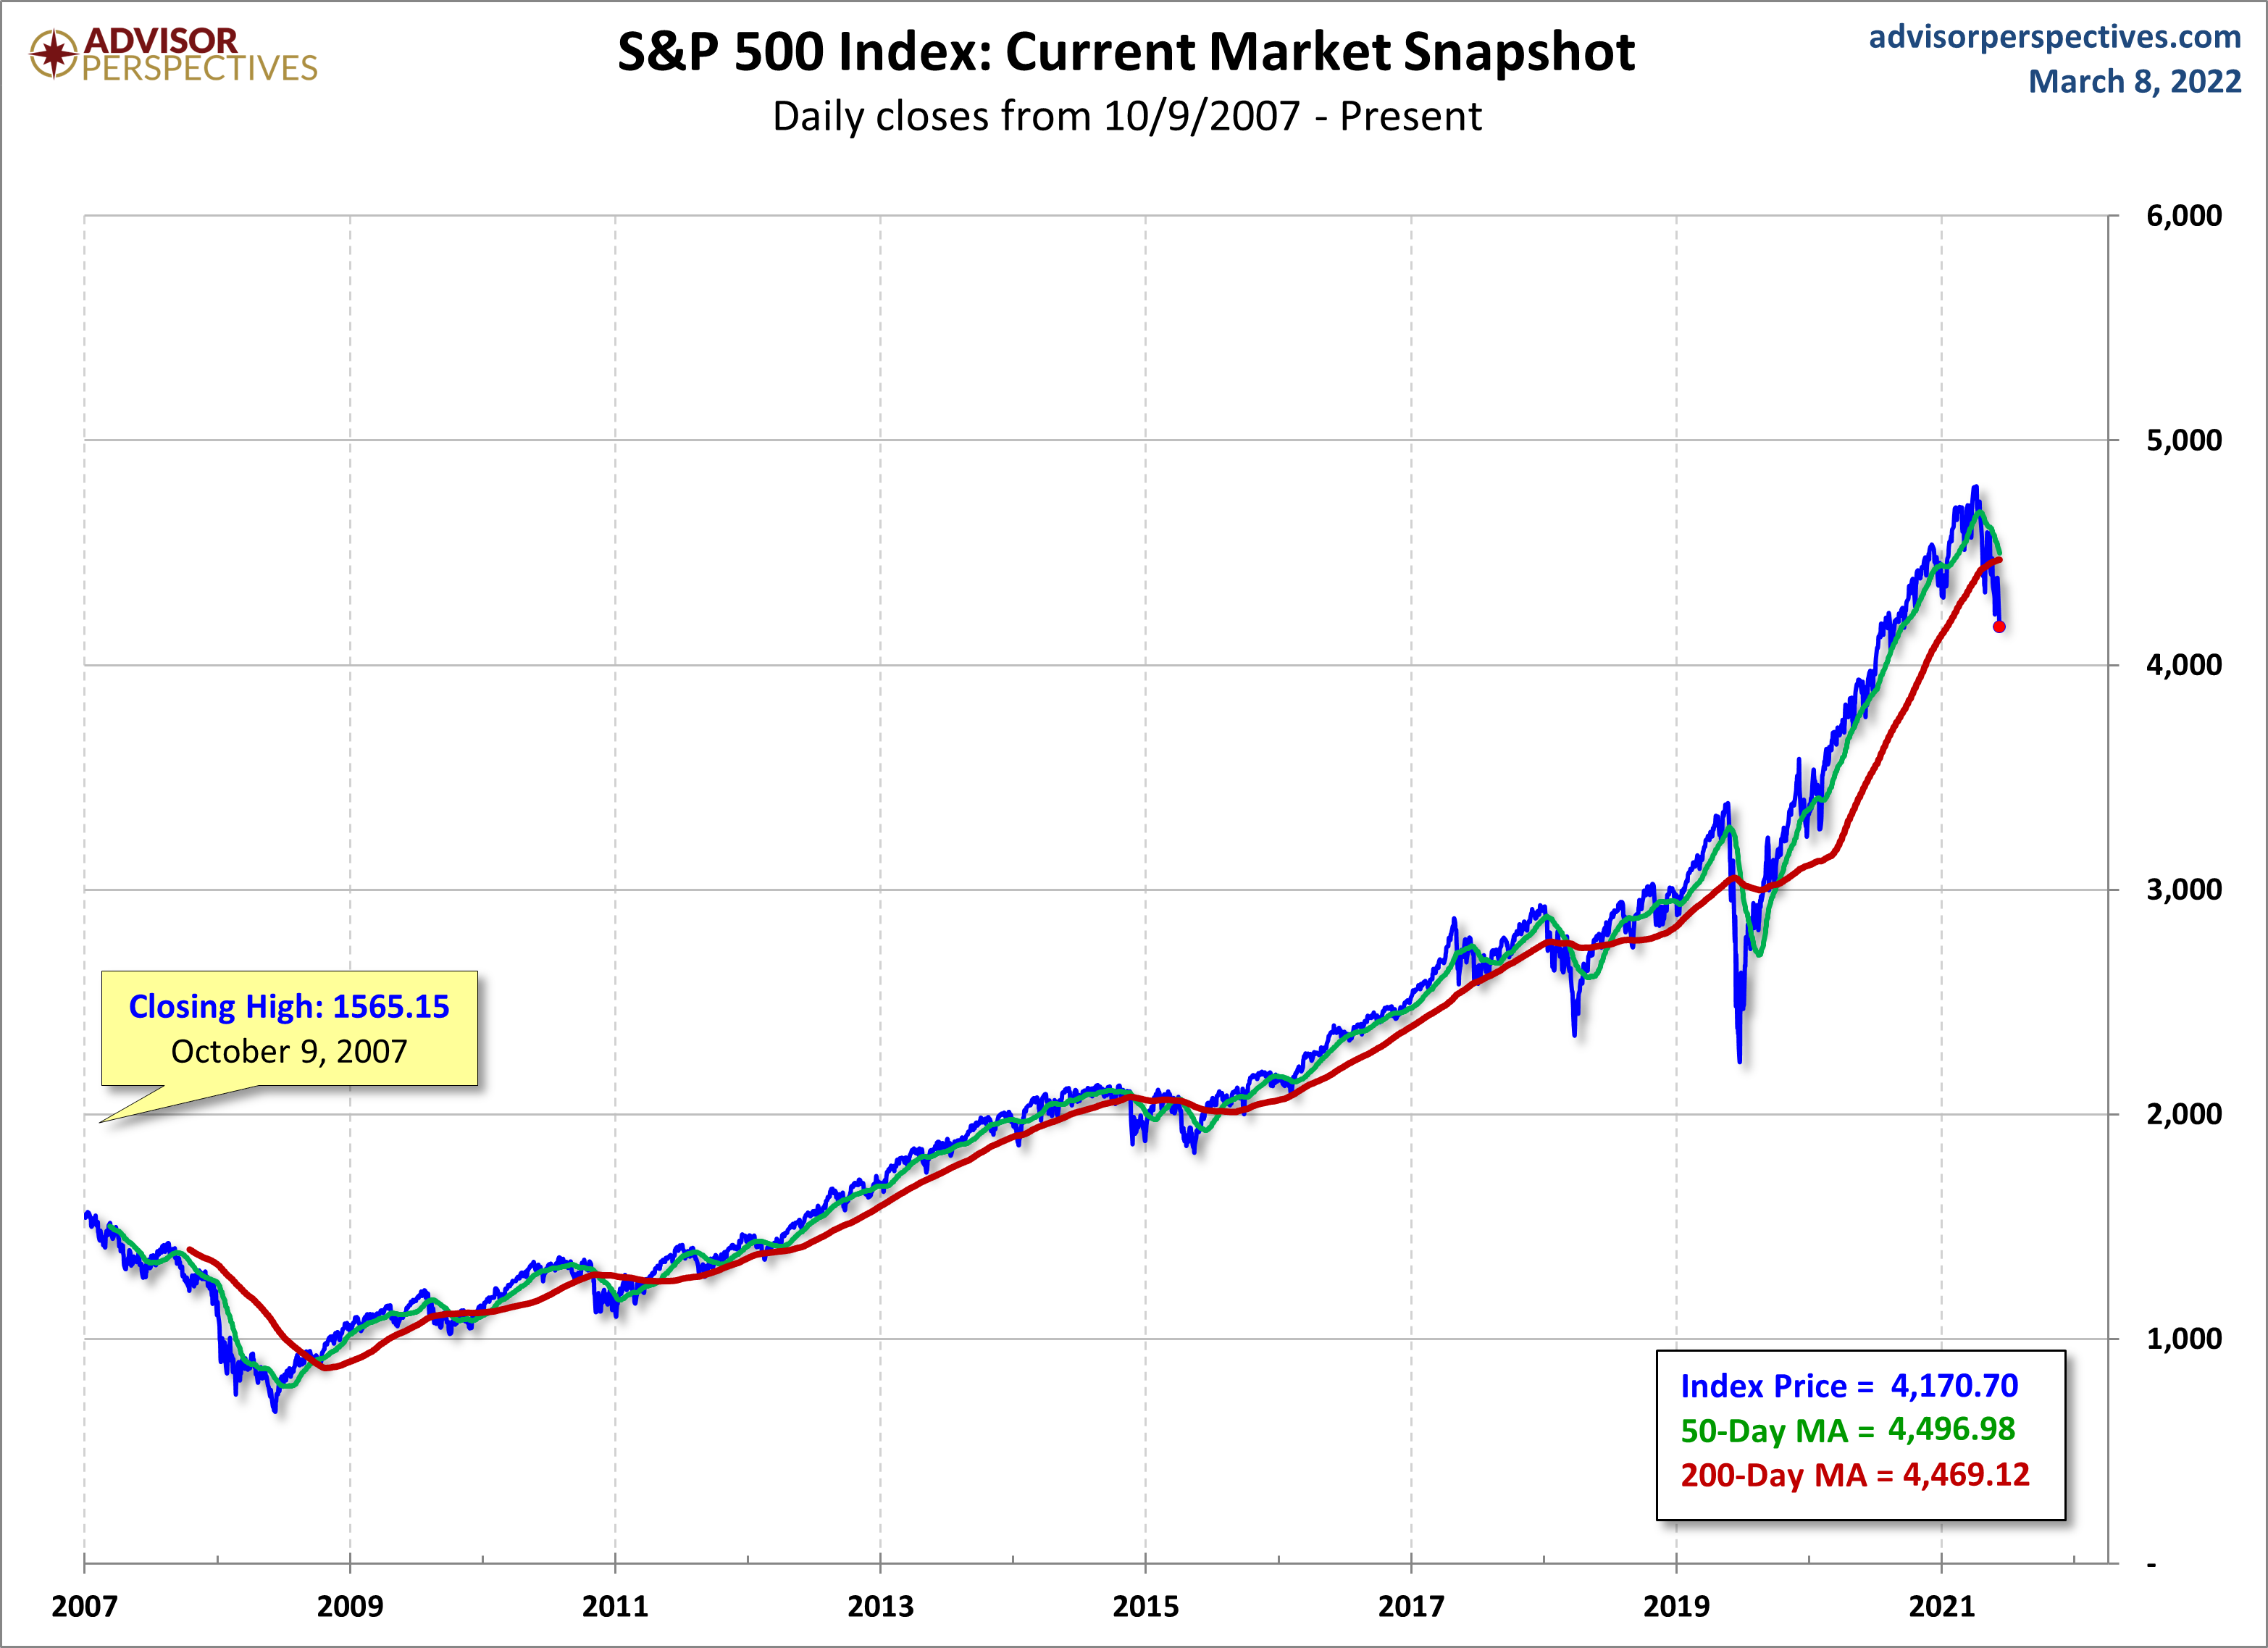
Here is a linear scale version of the same chart with the 50- and 200-day moving averages.
(Click on image to enlarge)
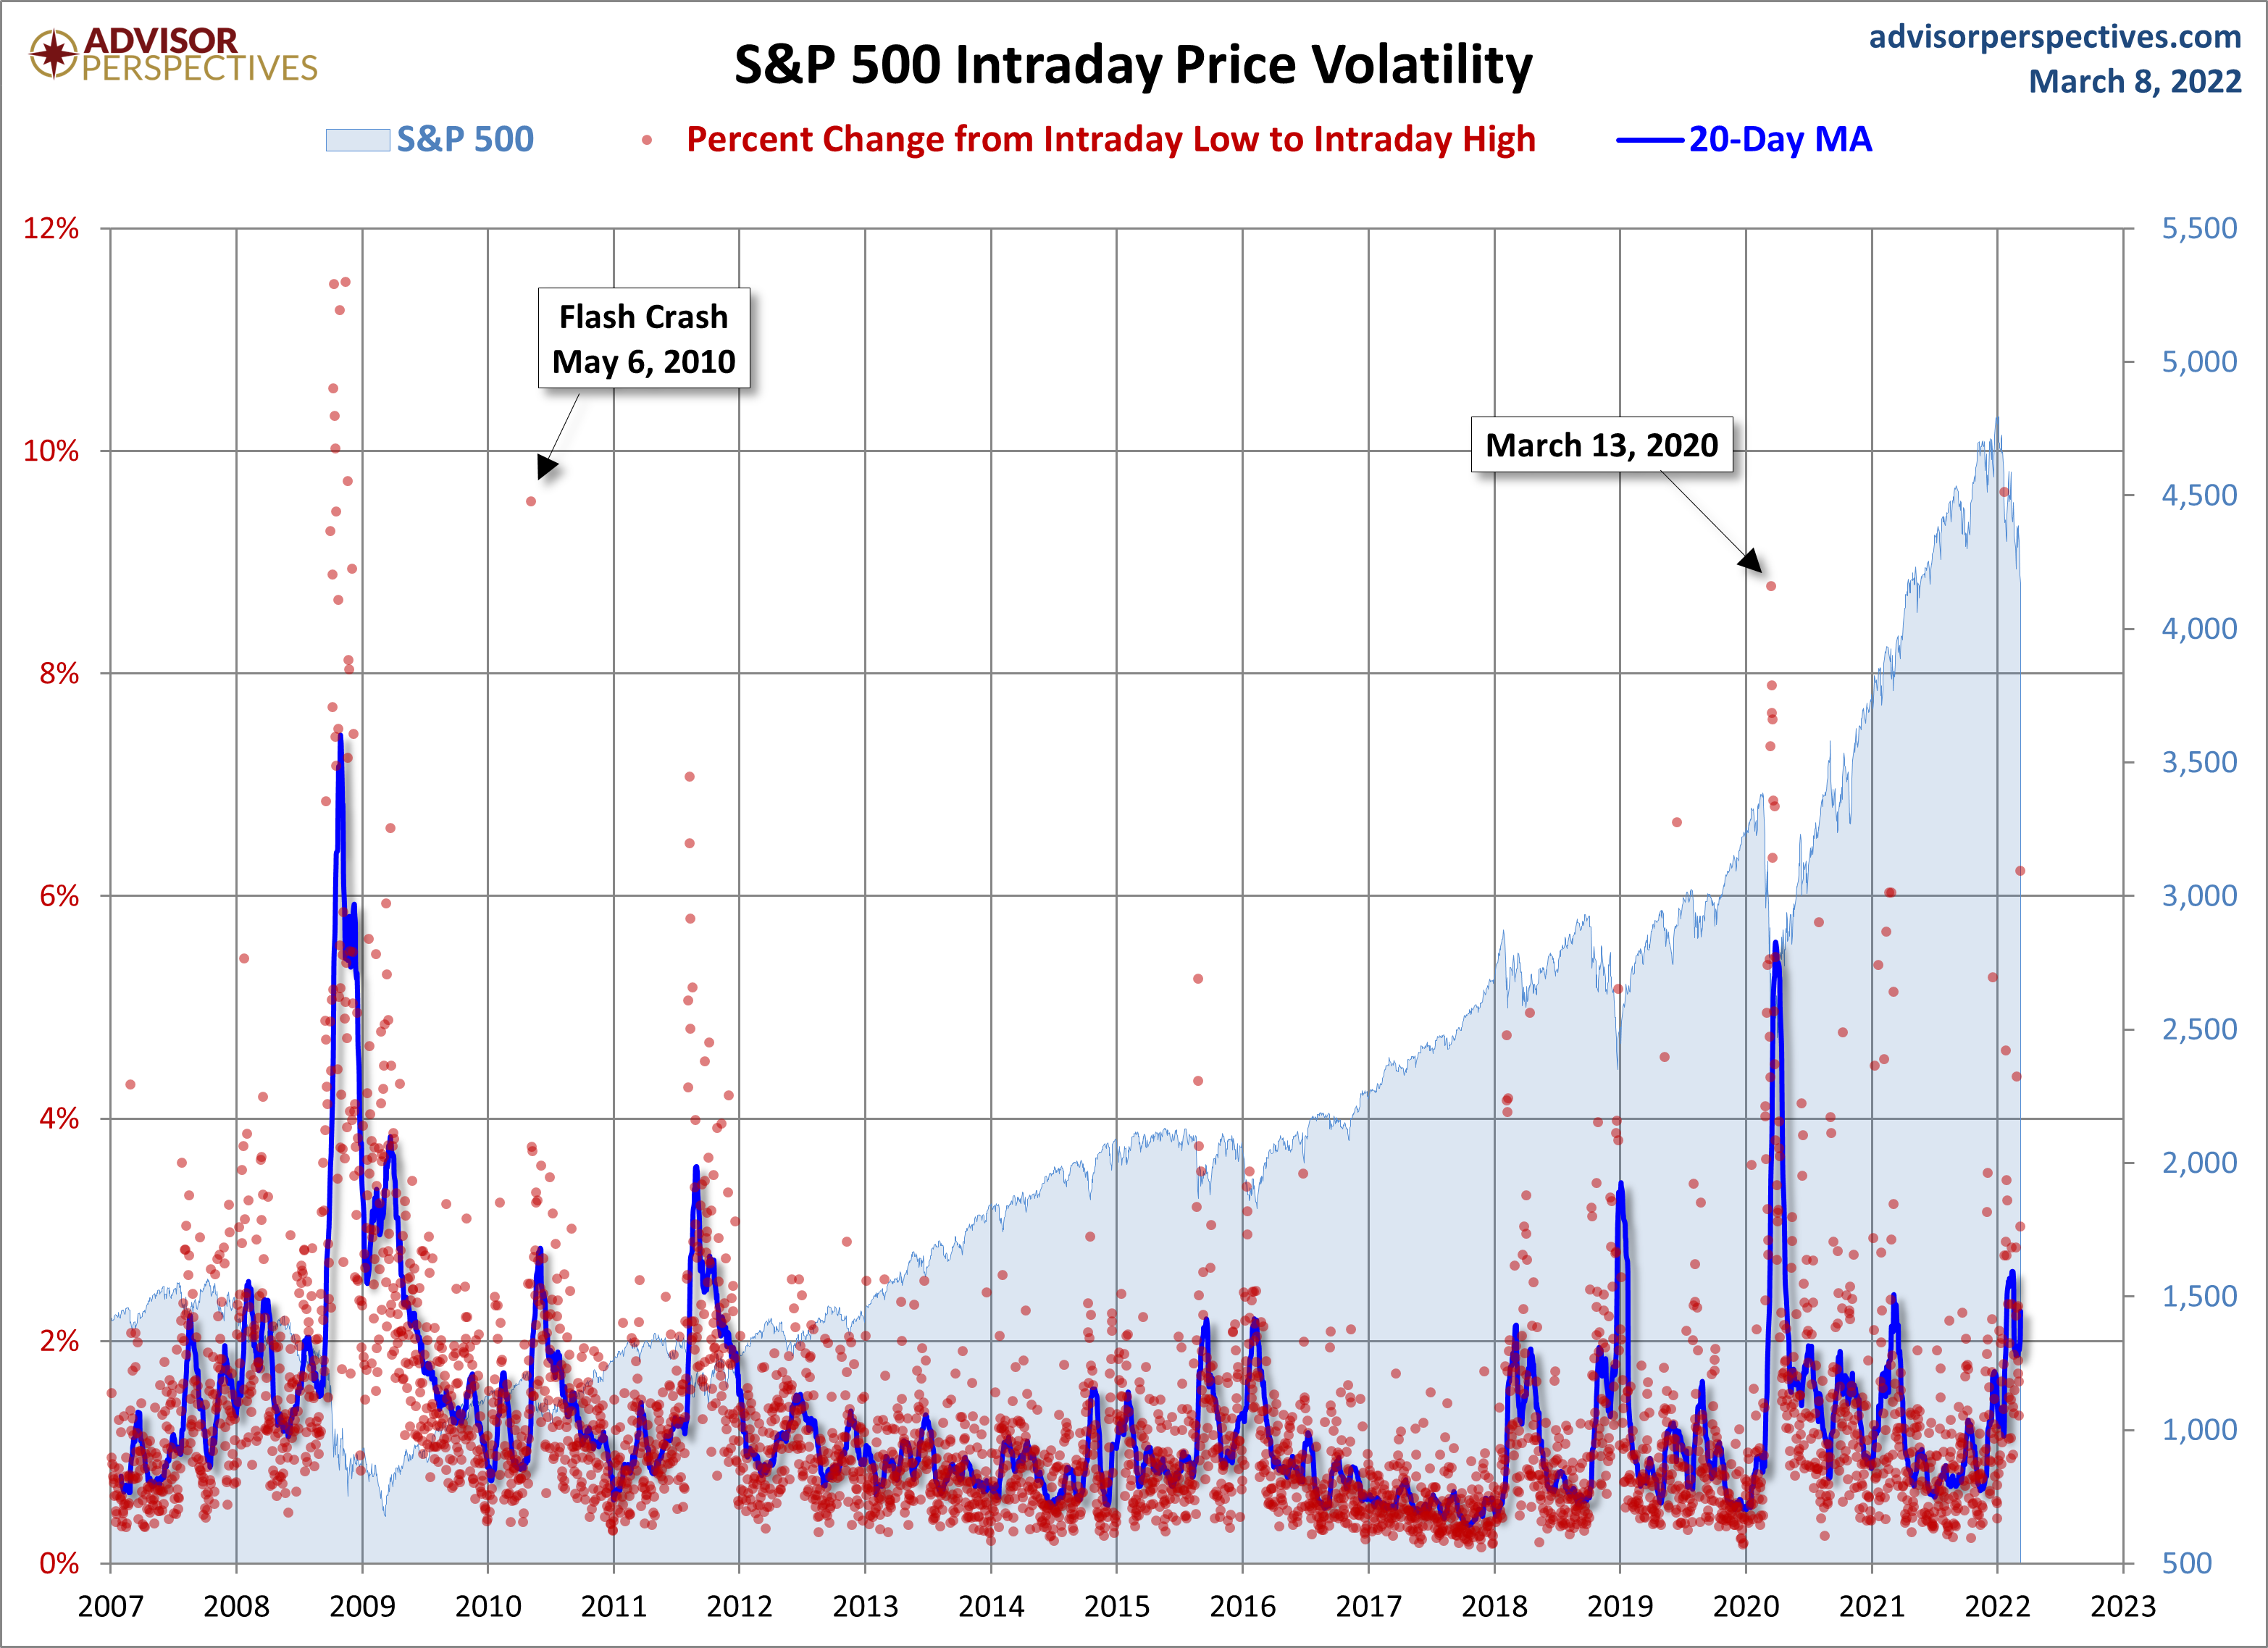
A Perspective on Volatility
For a sense of the correlation between the closing price and intraday volatility, the chart below overlays the S&P 500 since 2007 with the intraday price range. We've also included a 20-day moving average to help identify trends in volatility.
(Click on image to enlarge)
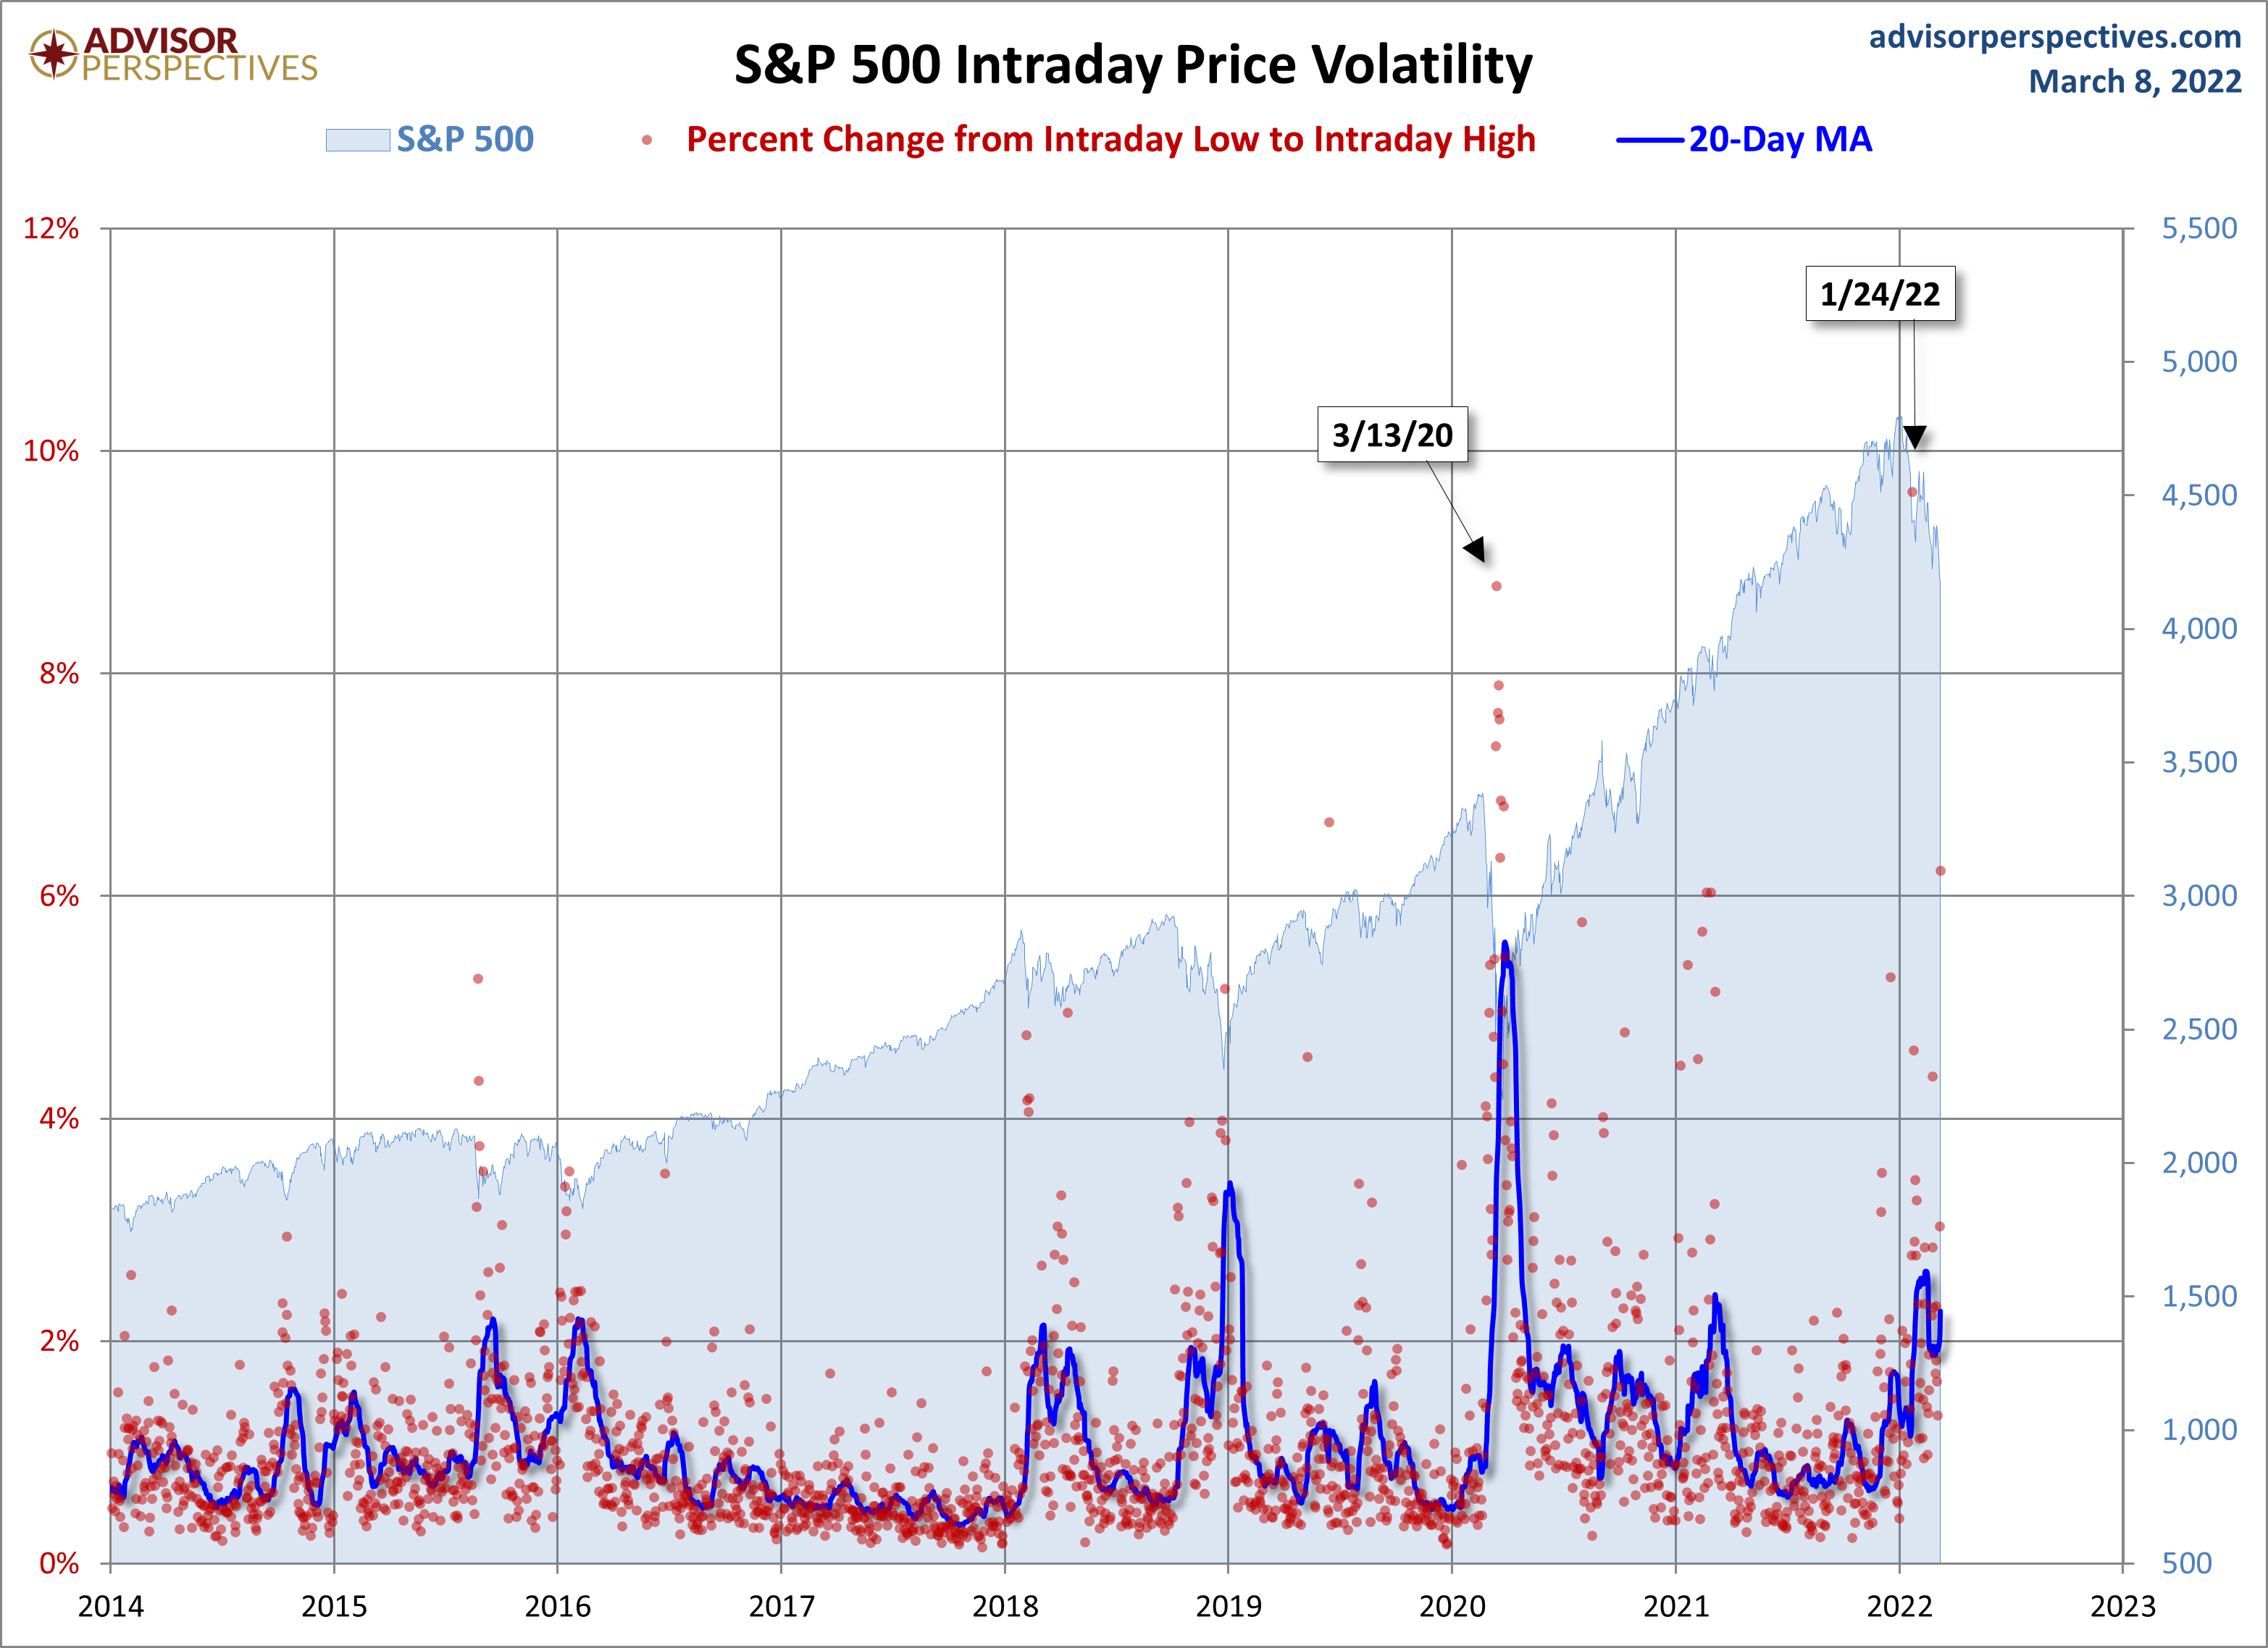
Here's another look, but a slightly more recent look at volatility since 2014.
(Click on image to enlarge)


Comments
Log in or sign up to join the conversation.