

European equity indexes finished today's session in the green during today's Brexit vote. The FTSE gained 1.23%, and the DAX and CAC rose an even more impressive 1.85% and 1.96% respectively. Our benchmark S&P 500 surged at the open, drifted higher to the noon hour, traded sideways until a second surge in the final 30 minutes. The index closed with a 1.34% advance, its largest since its 1.37% gain 21 sessions back on May 24th. As I type this, the UK polls are closing for the referendum vote. The index is now a mere 0.82% from its record close 13 months ago. Will a Brexit "stay" vote trigger a record close in tomorrow's trade? Stay tuned!
The 10-year note closed at 1.74%, up five basis points from the previous session.
Here is a snapshot of past five sessions in the S&P 500.

Here is a daily chart of the index. Volume was light on today's rally.

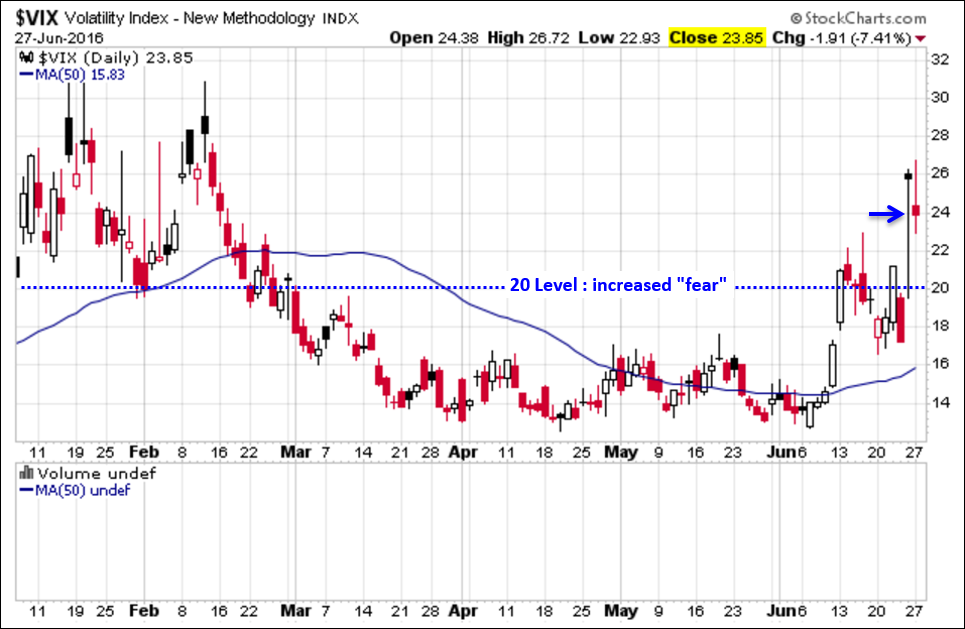
Here's a look at the VIX volatility index, the celebrated "fear gauge" market indicator. Today's rally dropped the the index below the legendary 20 threshold.
A Perspective on Drawdowns
Here's a snapshot of selloffs since the 2009 trough.
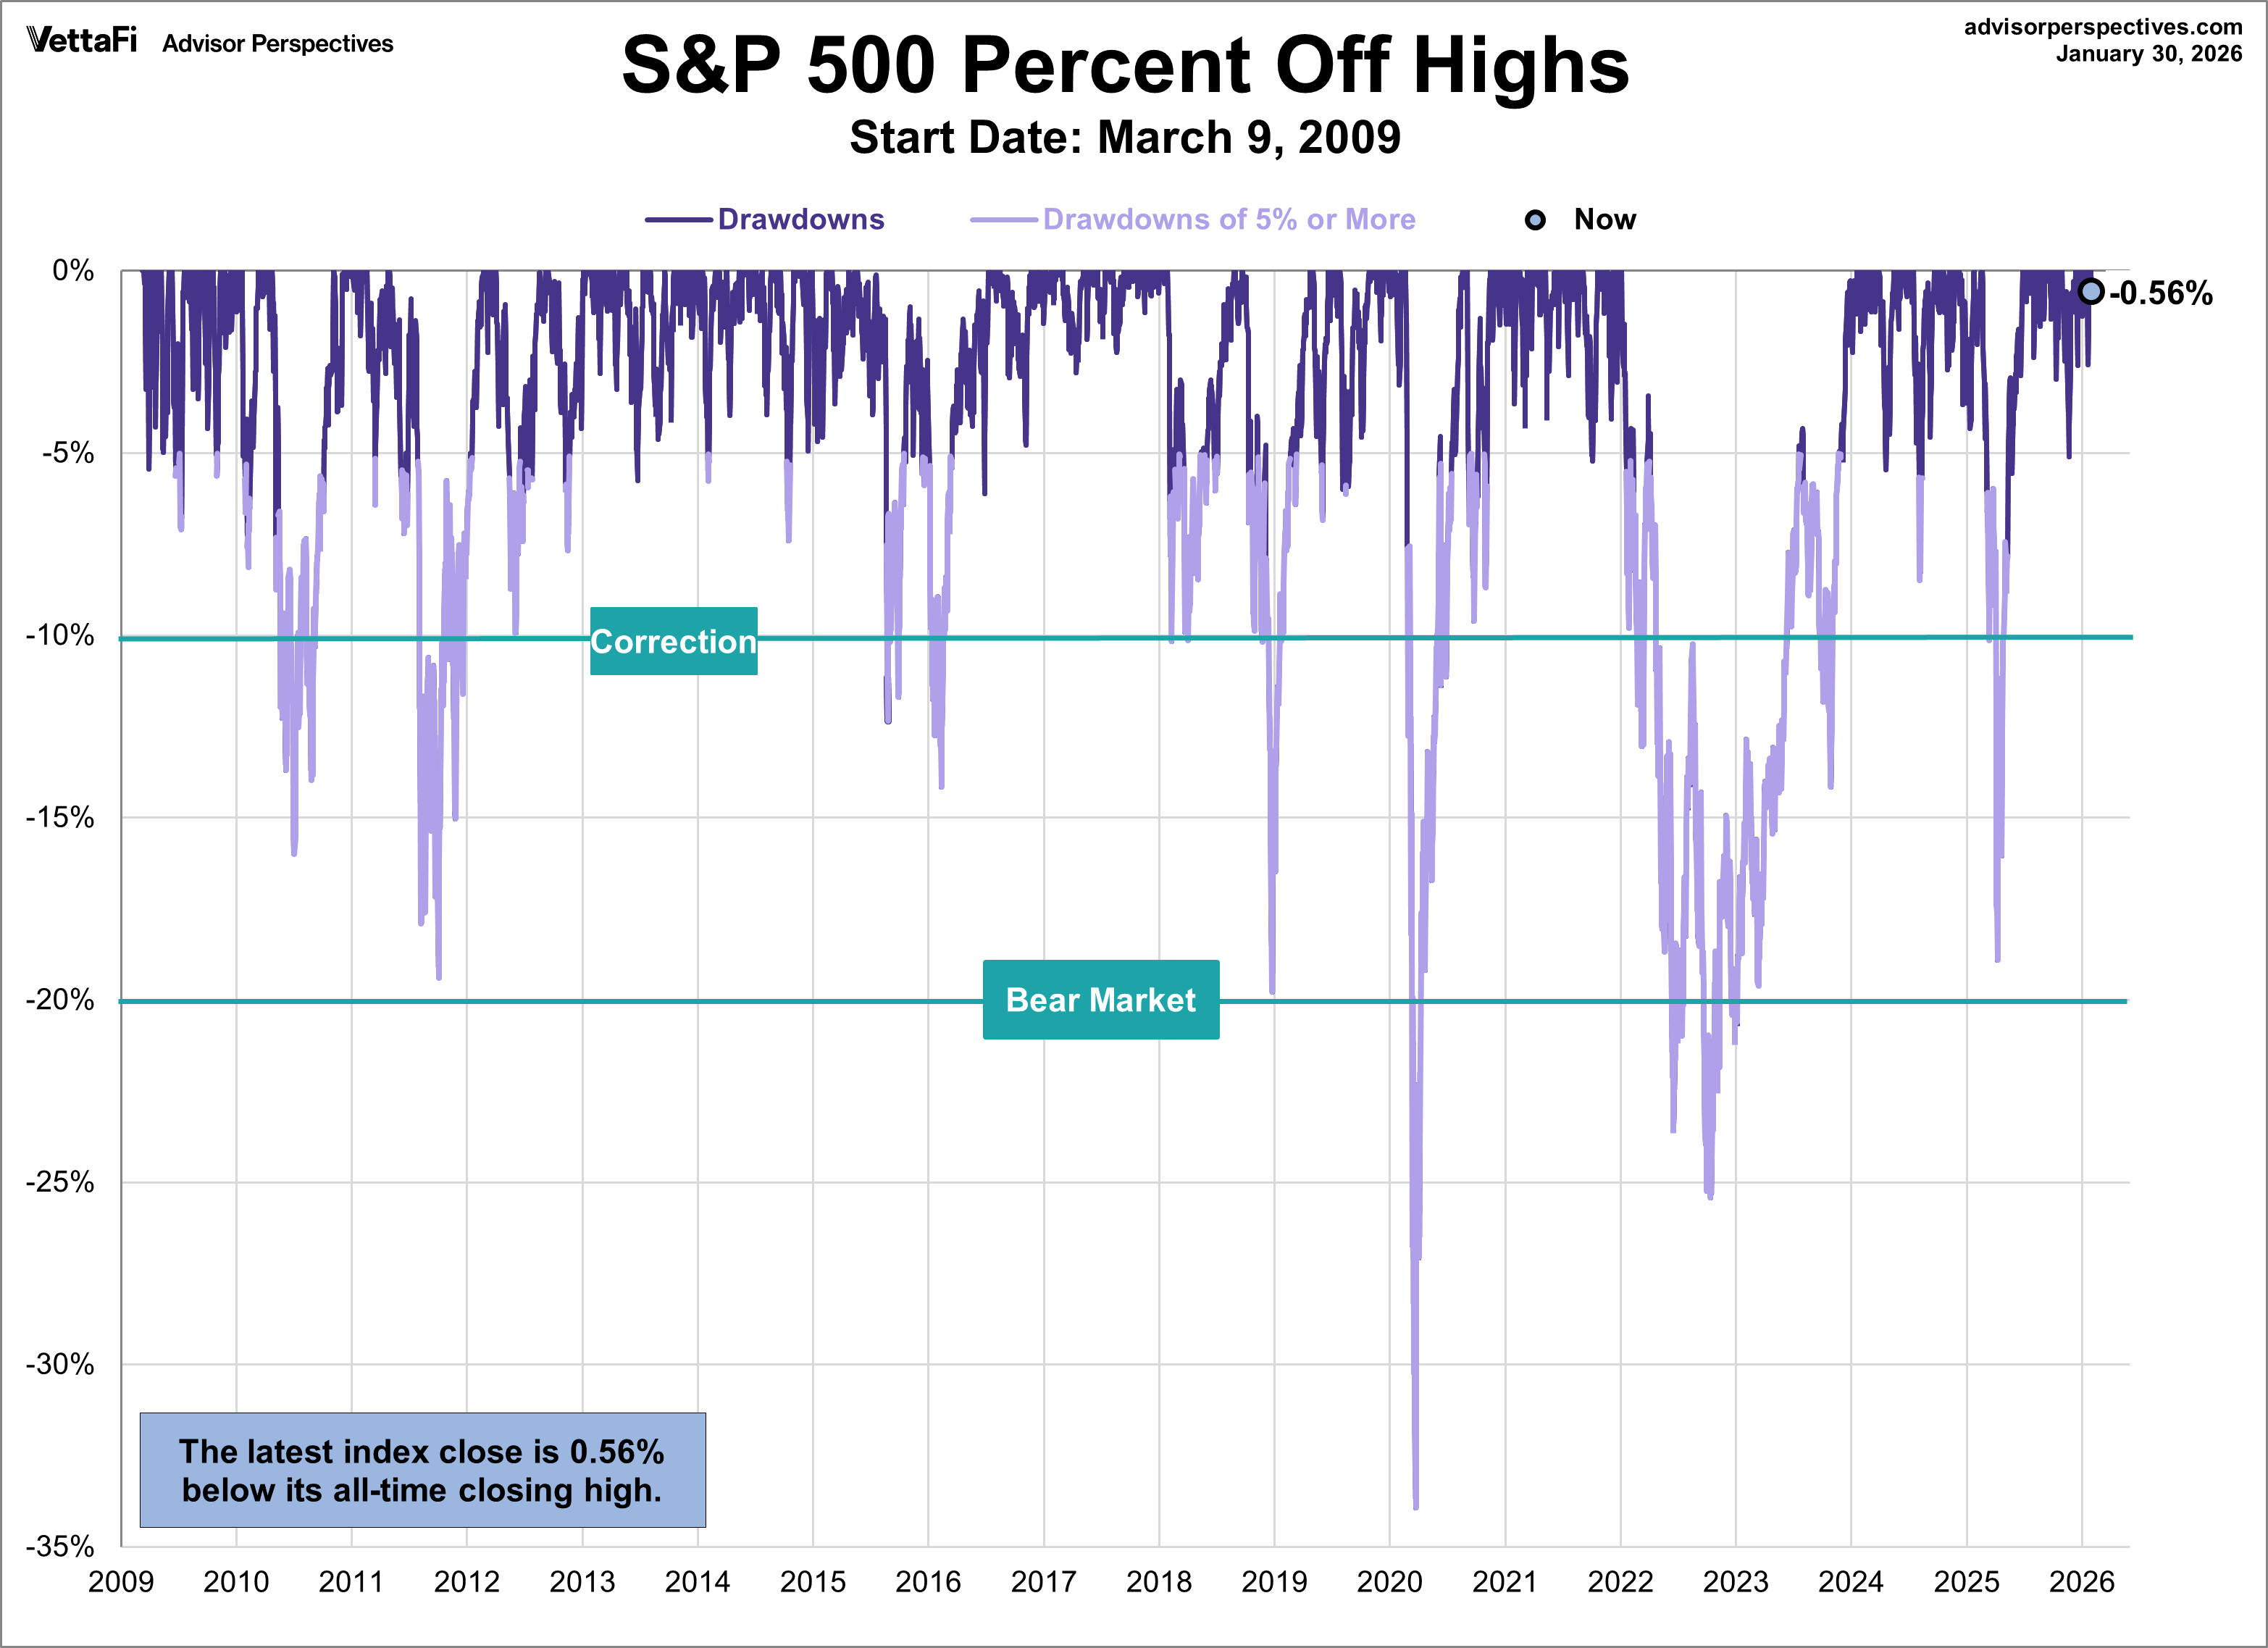
Here is a more conventional log-scale chart with drawdowns highlighted.
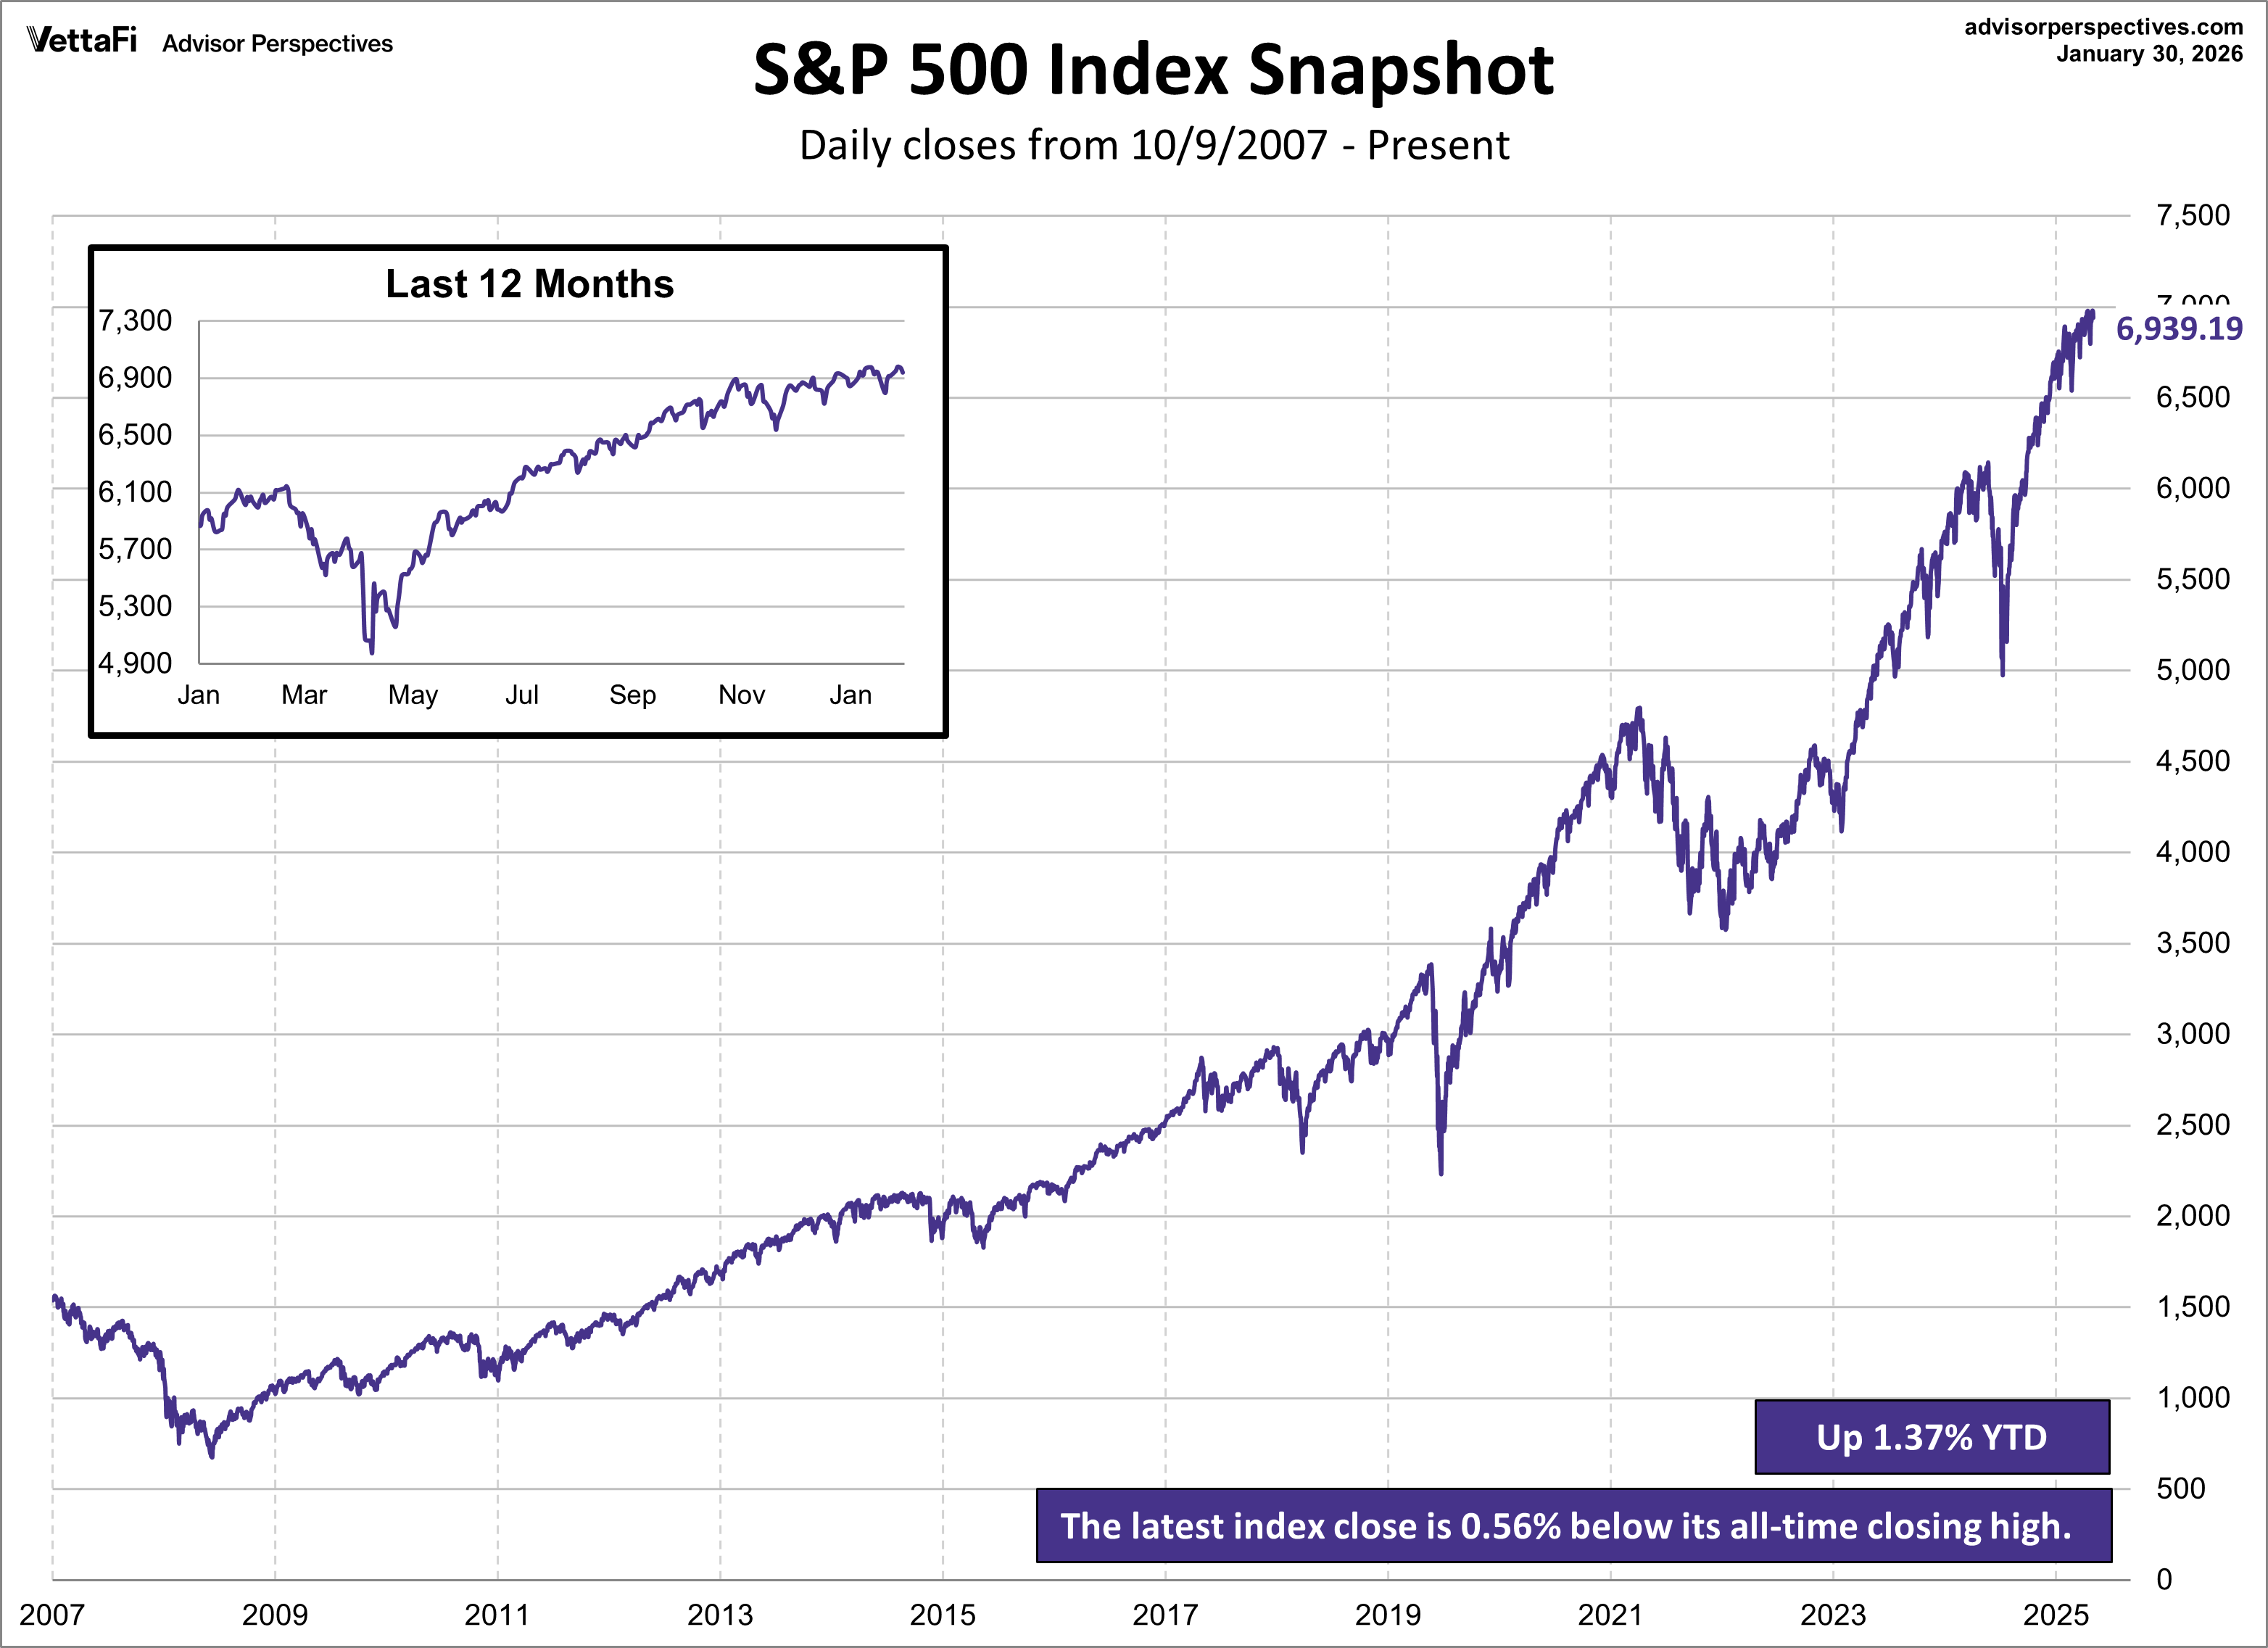
Here is a linear scale version of the same chart with the 50- and 200-day moving averages.

A Perspective on Volatility
For a sense of the correlation between the closing price and intraday volatility, the chart below overlays the S&P 500 since 2007 with the intraday price range. We've also included a 20-day moving average to help identify trends in volatility.




Comments
Log in or sign up to join the conversation.