
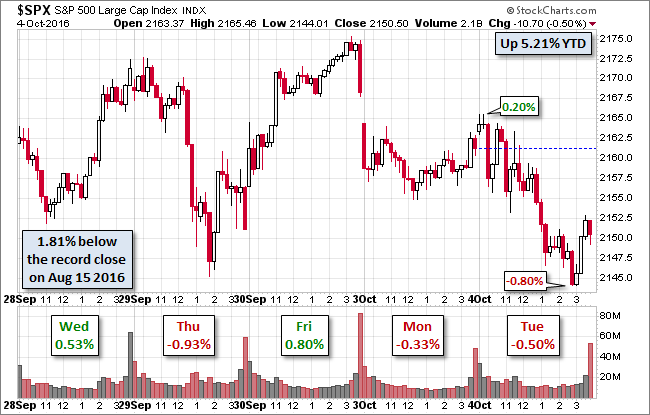
In the absence of economic news, US equity markets, always looking for catalysts, apparently seized on the dollar (which surged) and gold (which tanked) as today's market movers. The gold move was particularly dramatic, with the GLD ETF plunging 3.47%. The S&P 500 spent the morning in indecision then sold-off to its -0.80% intraday low shortly before the final hour of trading. The index then trimmed its loss to an even half percent at the close.
The yield on the 10-year note closed at 1.69%, up six basis points from the previous close.
Here is a snapshot of past five sessions in the S&P 500.
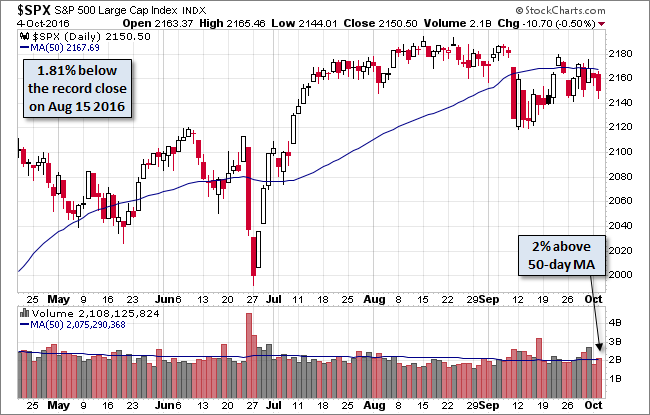
Here is daily chart of the index. Volume was unremarkable on today's selling.
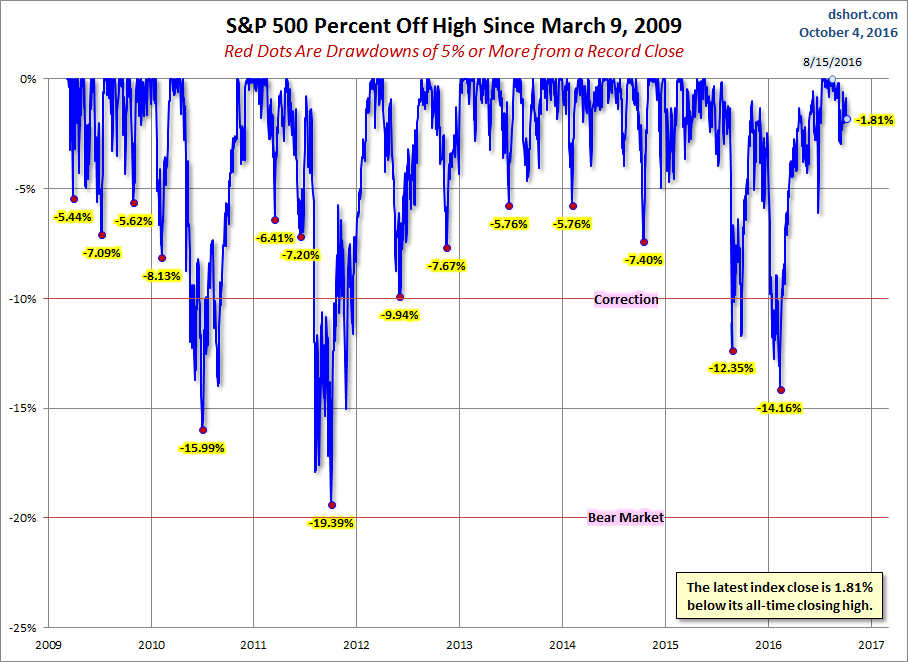
A Perspective on Drawdowns
Here's a snapshot of selloffs since the 2009 trough.
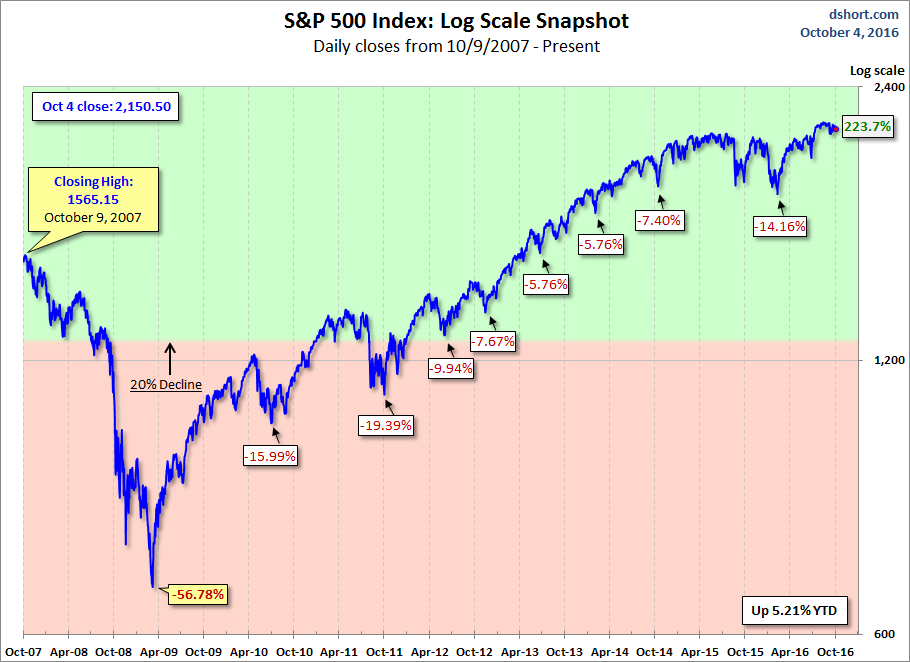
Here is a more conventional log-scale chart with drawdowns highlighted.
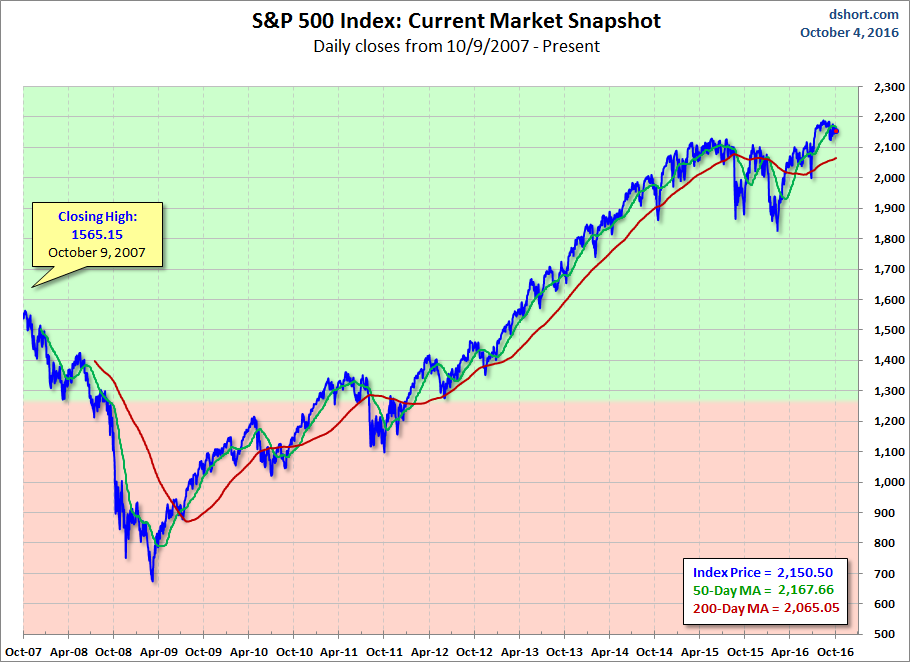
Here is a linear scale version of the same chart with the 50- and 200-day moving averages.
A Perspective on Volatility
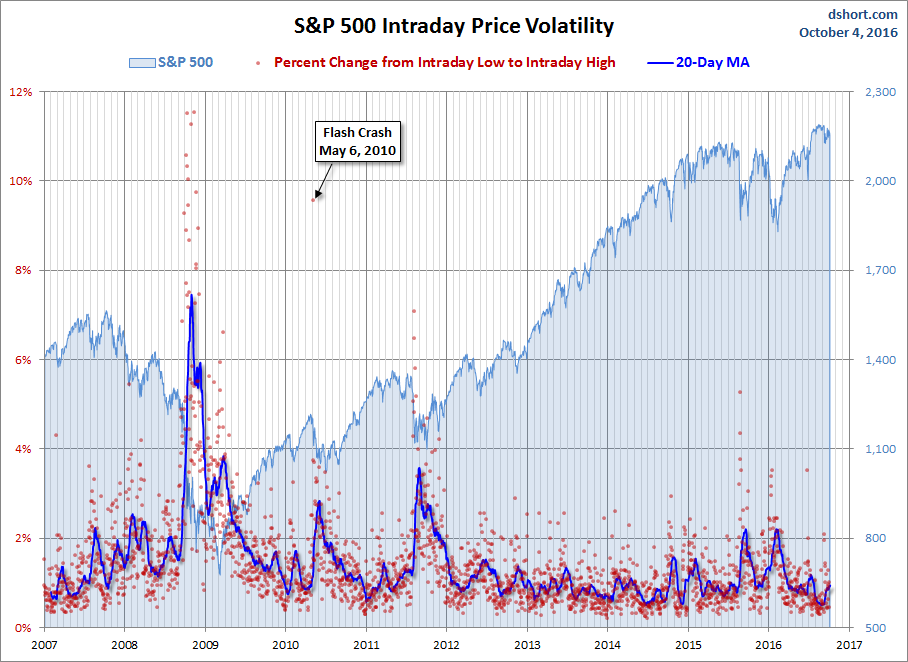
For a sense of the correlation between the closing price and intraday volatility, the chart below overlays the S&P 500 since 2007 with the intraday price range. We've also included a 20-day moving average to help identify trends in volatility.


Comments
Log in or sign up to join the conversation.