

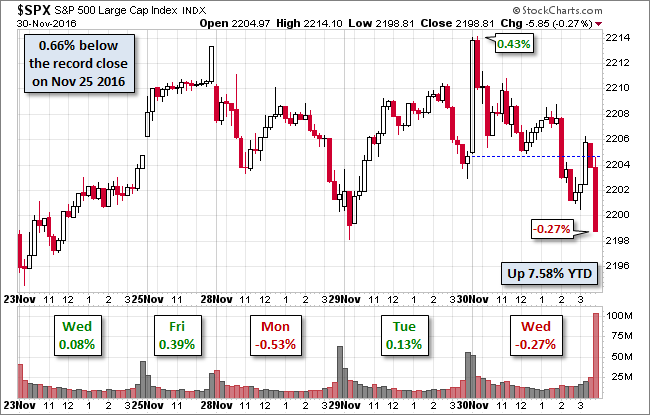
The S&P 500 popped at the open and hit its 0.43% intraday high about 15 minutes into the session. The rest of the day was a pattern of zig-zagging downward to the its -0.27% intraday low at the close. On a brighter note, the index posted a 3.42% monthly gain, its best since its 3.56% July advance.
The sell-off in Treasuries resumed today. The yield on the 10-year note closed at 2.37%, up seven BPs from the previous close and an interim high, the highest close since mid-July 2015.
(Click on image to enlarge)
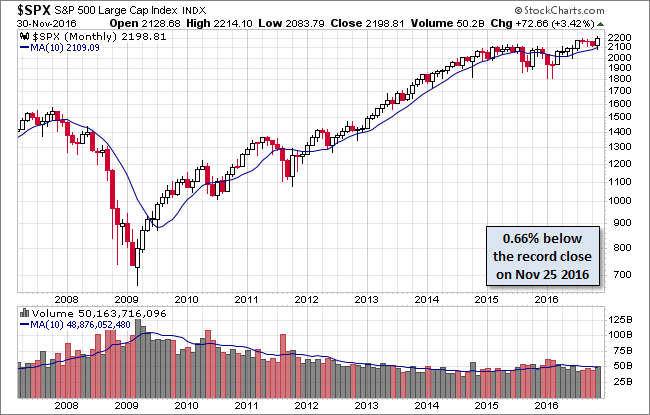
For a longer perspective, here's a monthly chart of the S&P 500.
(Click on image to enlarge)
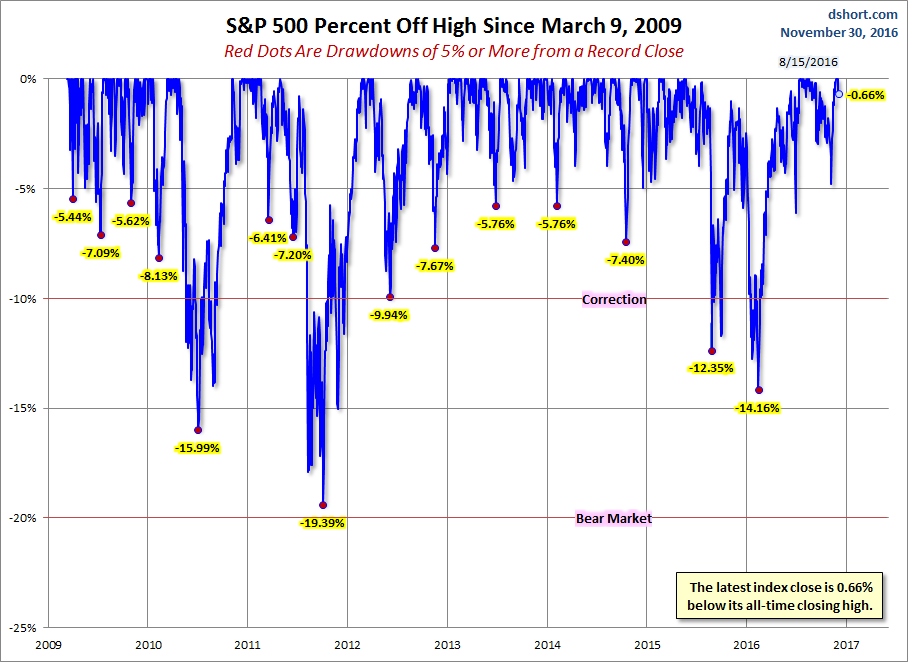
A Perspective on Drawdowns
Here's a snapshot of selloffs since the 2009 trough.
(Click on image to enlarge)
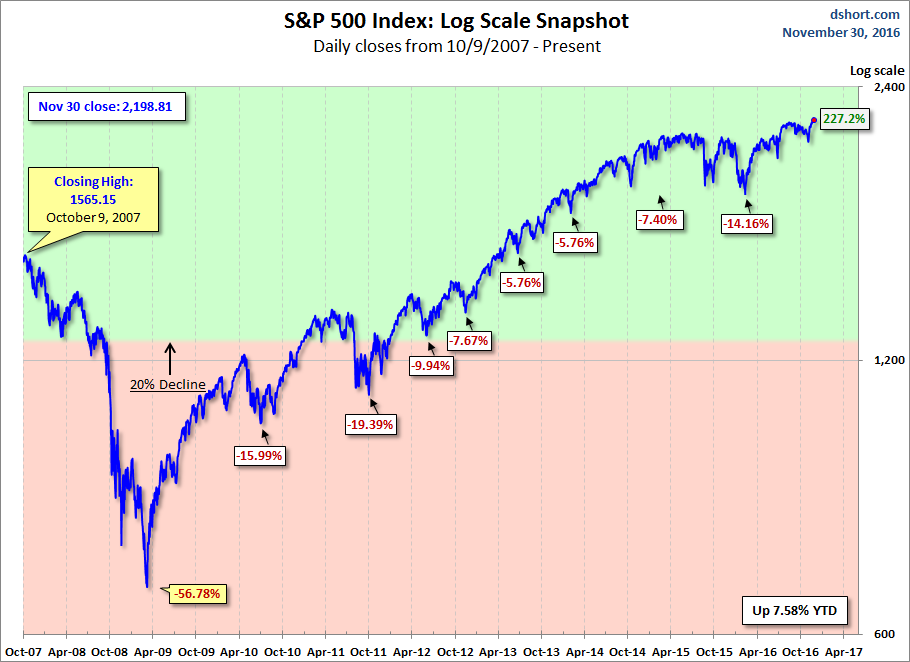
Here is a more conventional log-scale chart with drawdowns highlighted.
(Click on image to enlarge)
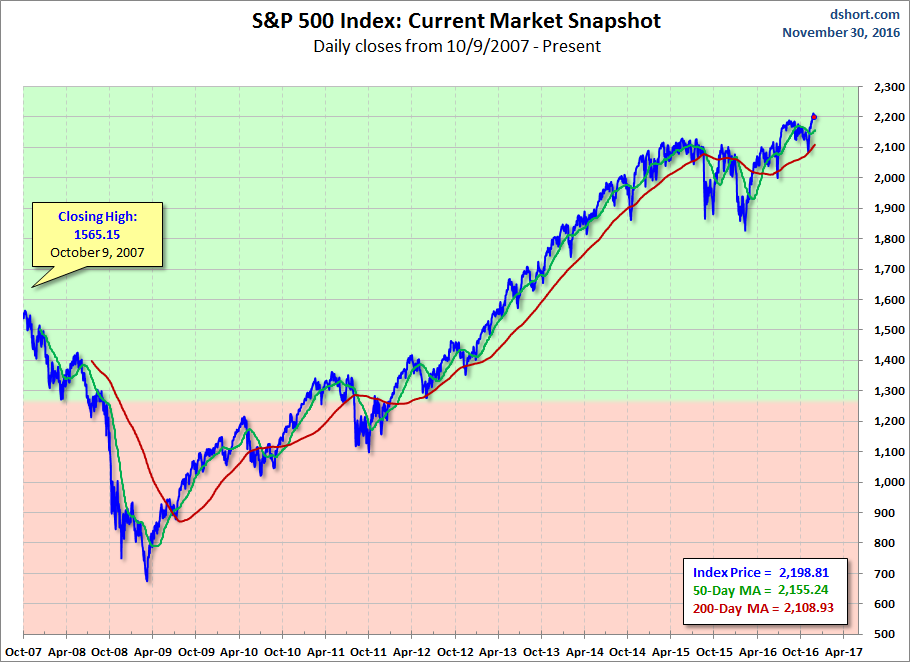
Here is a linear scale version of the same chart with the 50- and 200-day moving averages.
(Click on image to enlarge)
A Perspective on Volatility
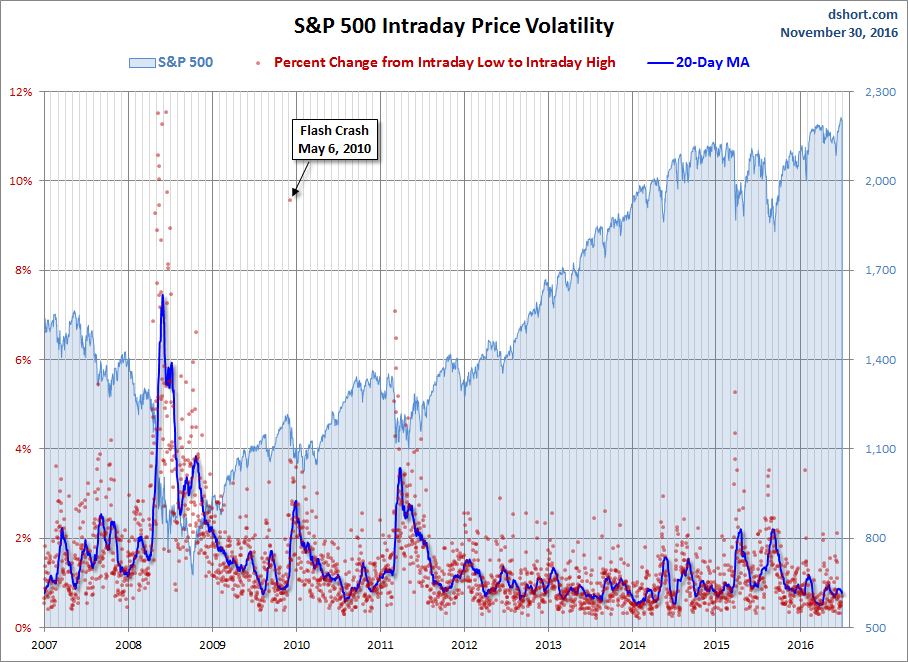
For a sense of the correlation between the closing price and intraday volatility, the chart below overlays the S&P 500 since 2007 with the intraday price range. We've also included a 20-day moving average to help identify trends in volatility.
(Click on image to enlarge)



Comments
Log in or sign up to join the conversation.