

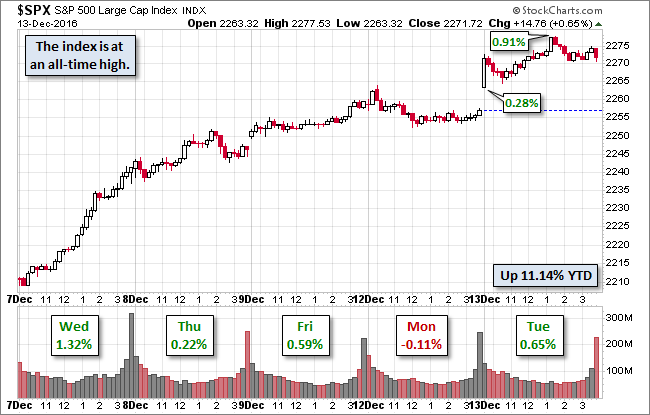
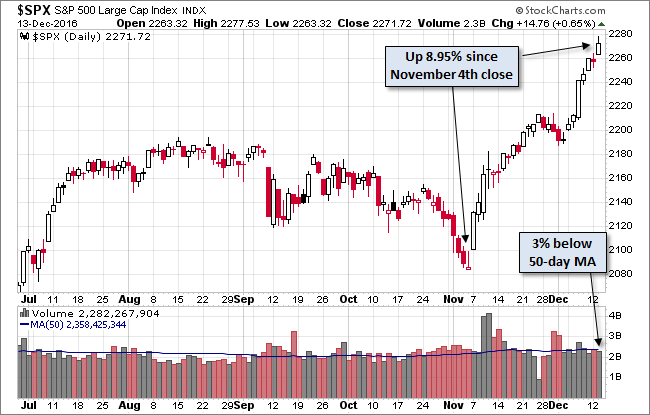
After yesterday's breather (a fractional 0.11% decline) the S&P 500 moved back into rally mode. The index popped at the open, contracted a bit, and then rose to its 0.91% early-afternoon high. It then drifted lower to a narrow trading range before its 0.65% gain at the bell, which was another record close. The S&P 500 has now risen 8.95% since in the rally that began on the Monday before the presidential election. There are two big questions in advance of tomorrow's market action: 1) will the Fed announce a rate hike? and 2) how will the market react to the decision (whichever way it goes)?
Here is a snapshot of the past five sessions.
(Click on image to enlarge)
The selloff in treasuries continued today with the yield on the 10-year note closing at 2.48%, down one BP from its previous close.
Here is a daily chart of the index. Trading volume on today's record close was unremarkable.
(Click on image to enlarge)
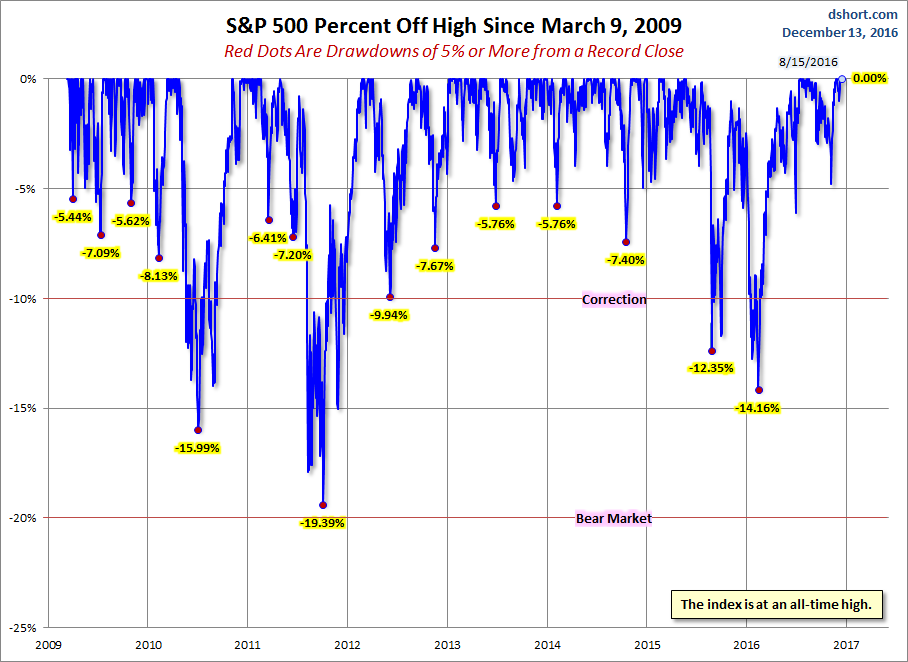
A Perspective on Drawdowns
Here's a snapshot of selloffs since the 2009 trough.
(Click on image to enlarge)
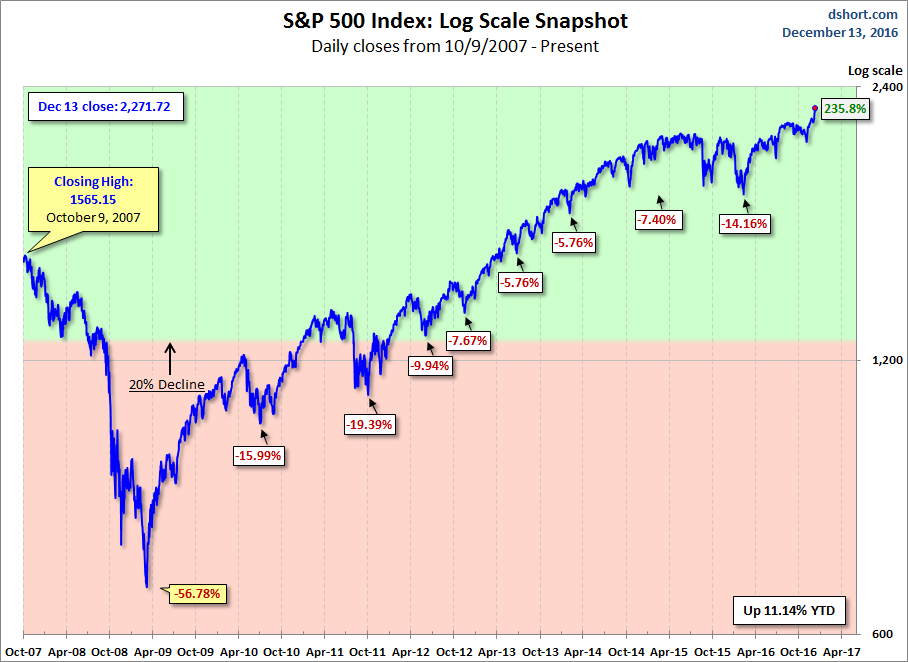
Here is a more conventional log-scale chart with drawdowns highlighted.
(Click on image to enlarge)
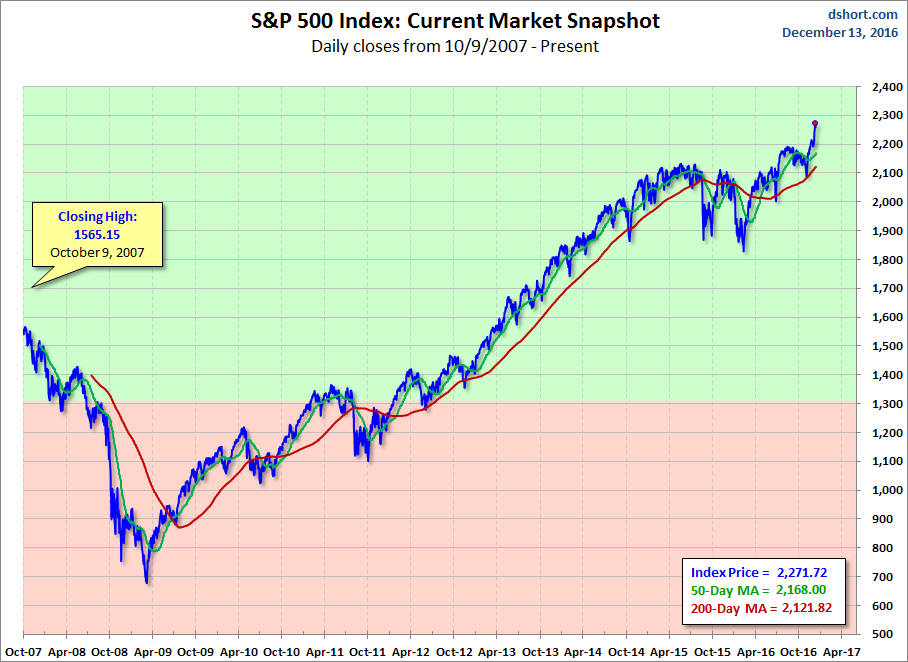
Here is a linear scale version of the same chart with the 50- and 200-day moving averages.
(Click on image to enlarge)
A Perspective on Volatility
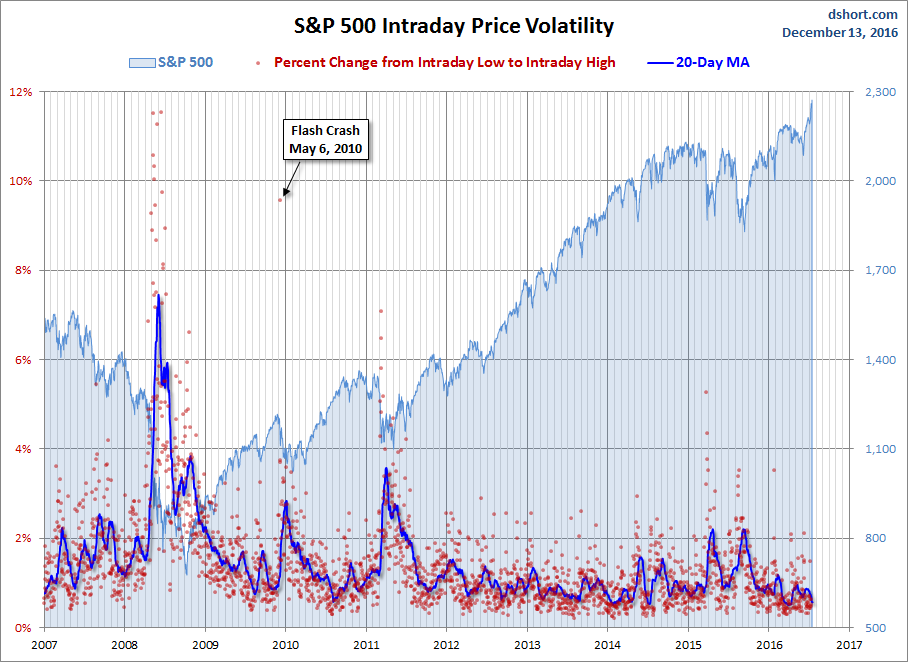
For a sense of the correlation between the closing price and intraday volatility, the chart below overlays the S&P 500 since 2007 with the intraday price range. We've also included a 20-day moving average to help identify trends in volatility.
(Click on image to enlarge)



Comments
Log in or sign up to join the conversation.