
The big event for the market this week is, of course, Friday's employment report. But today we got some popular clues about manufacturing. The Markit PMI hit a three-month low, still in expansion but a disappointingly slow one. The ISM PMI showed comparably slow expansion, but the September number was a welcome bounce from contraction in August. Our benchmark S&P 500 opened lower and zigzagged to its -0.62% intraday low during the lunch hour. It struggled higher in the afternoon and cut the loss to -0.33% at the close.
The yield on the 10-year note closed at 1.63%, up three basis points from the previous close but down two BPs from the previous weekly close.
Here is a snapshot of past five sessions in the S&P 500.
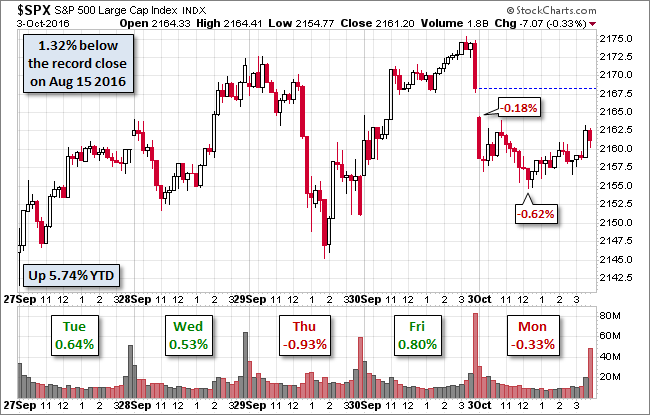
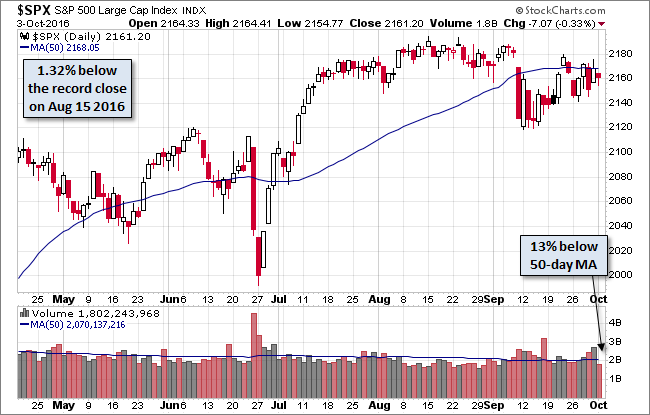
Here is daily chart of the index. Volume was light on today's selling.
(Click on image to enlarge)
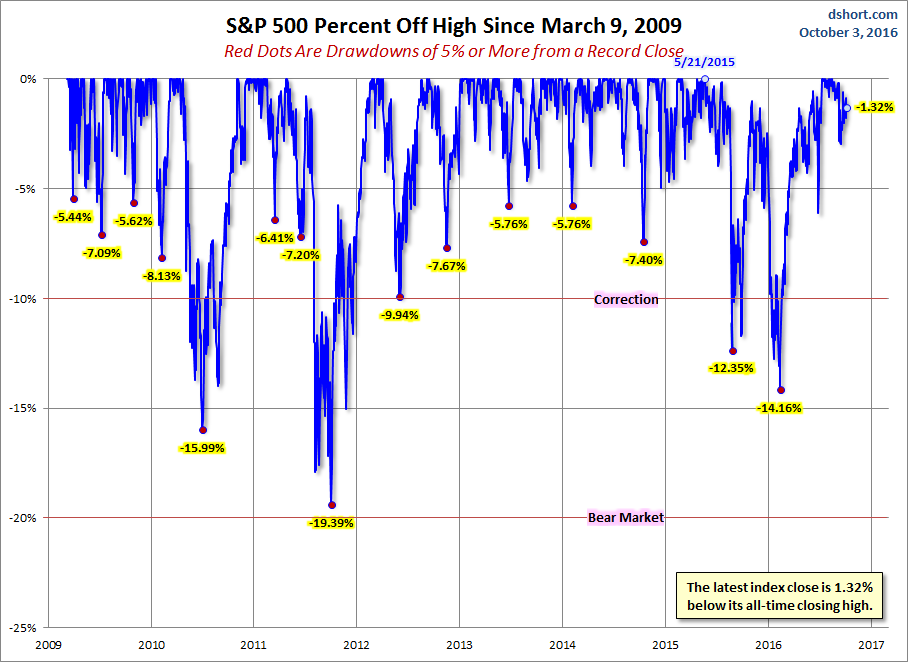
A Perspective on Drawdowns
Here's a snapshot of selloffs since the 2009 trough.
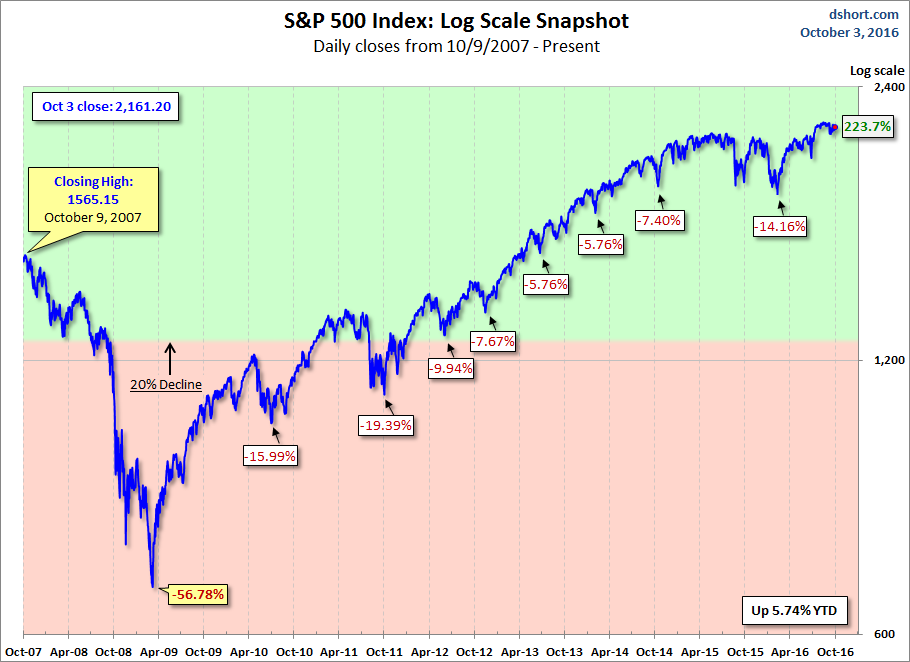
Here is a more conventional log-scale chart with drawdowns highlighted.
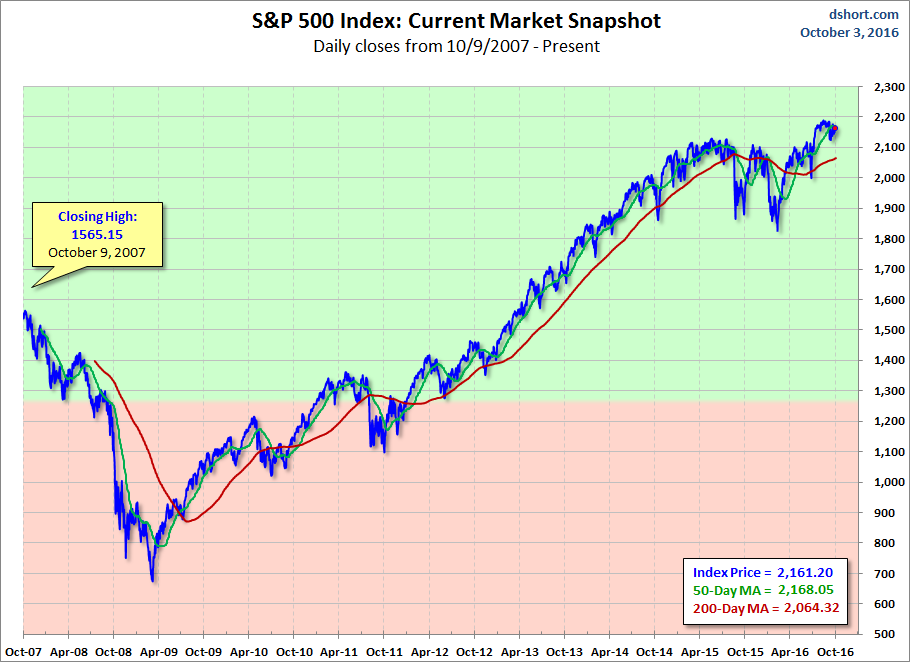
Here is a linear scale version of the same chart with the 50- and 200-day moving averages.
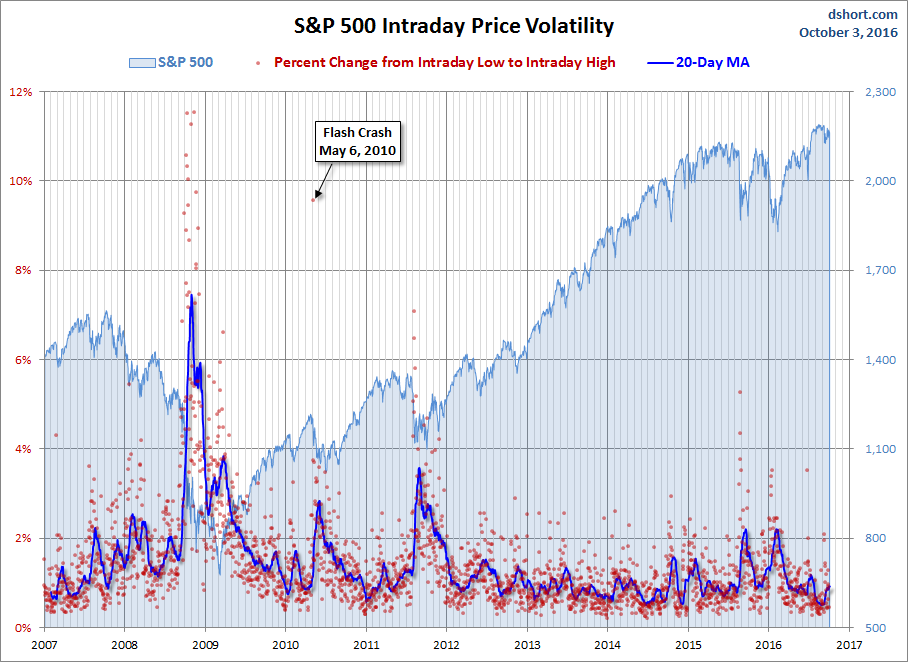
A Perspective on Volatility
For a sense of the correlation between the closing price and intraday volatility, the chart below overlays the S&P 500 since 2007 with the intraday price range. We've also included a 20-day moving average to help identify trends in volatility.


Comments
Log in or sign up to join the conversation.