

On a day absent of economic data, all eyes (that weren't on vacation) were focused on the 2 PM release of the July FOMC minutes. The S&P 500 dropped at the open, sold off to its -0.44% intraday low in the late morning, and then recovered to the vicinity of yesterday's close. Today's Fed effect was minimal. The relatively small spike in volume was accompanied by less fast trade volatility than we usually see on Fed Wednesdays. The 500 ended the day with a modest 0.19% gain, a tad below its 0.23% intraday high shortly before the final bell.
The yield on the 10-year notedropped a single BP to close at 1.56%.
Here is a snapshot of past five sessions in the S&P 500.

As we see on the daily chart, even the FOMC minutes didn't produce enough participation to lift the trading volume above its 50-day moving average.

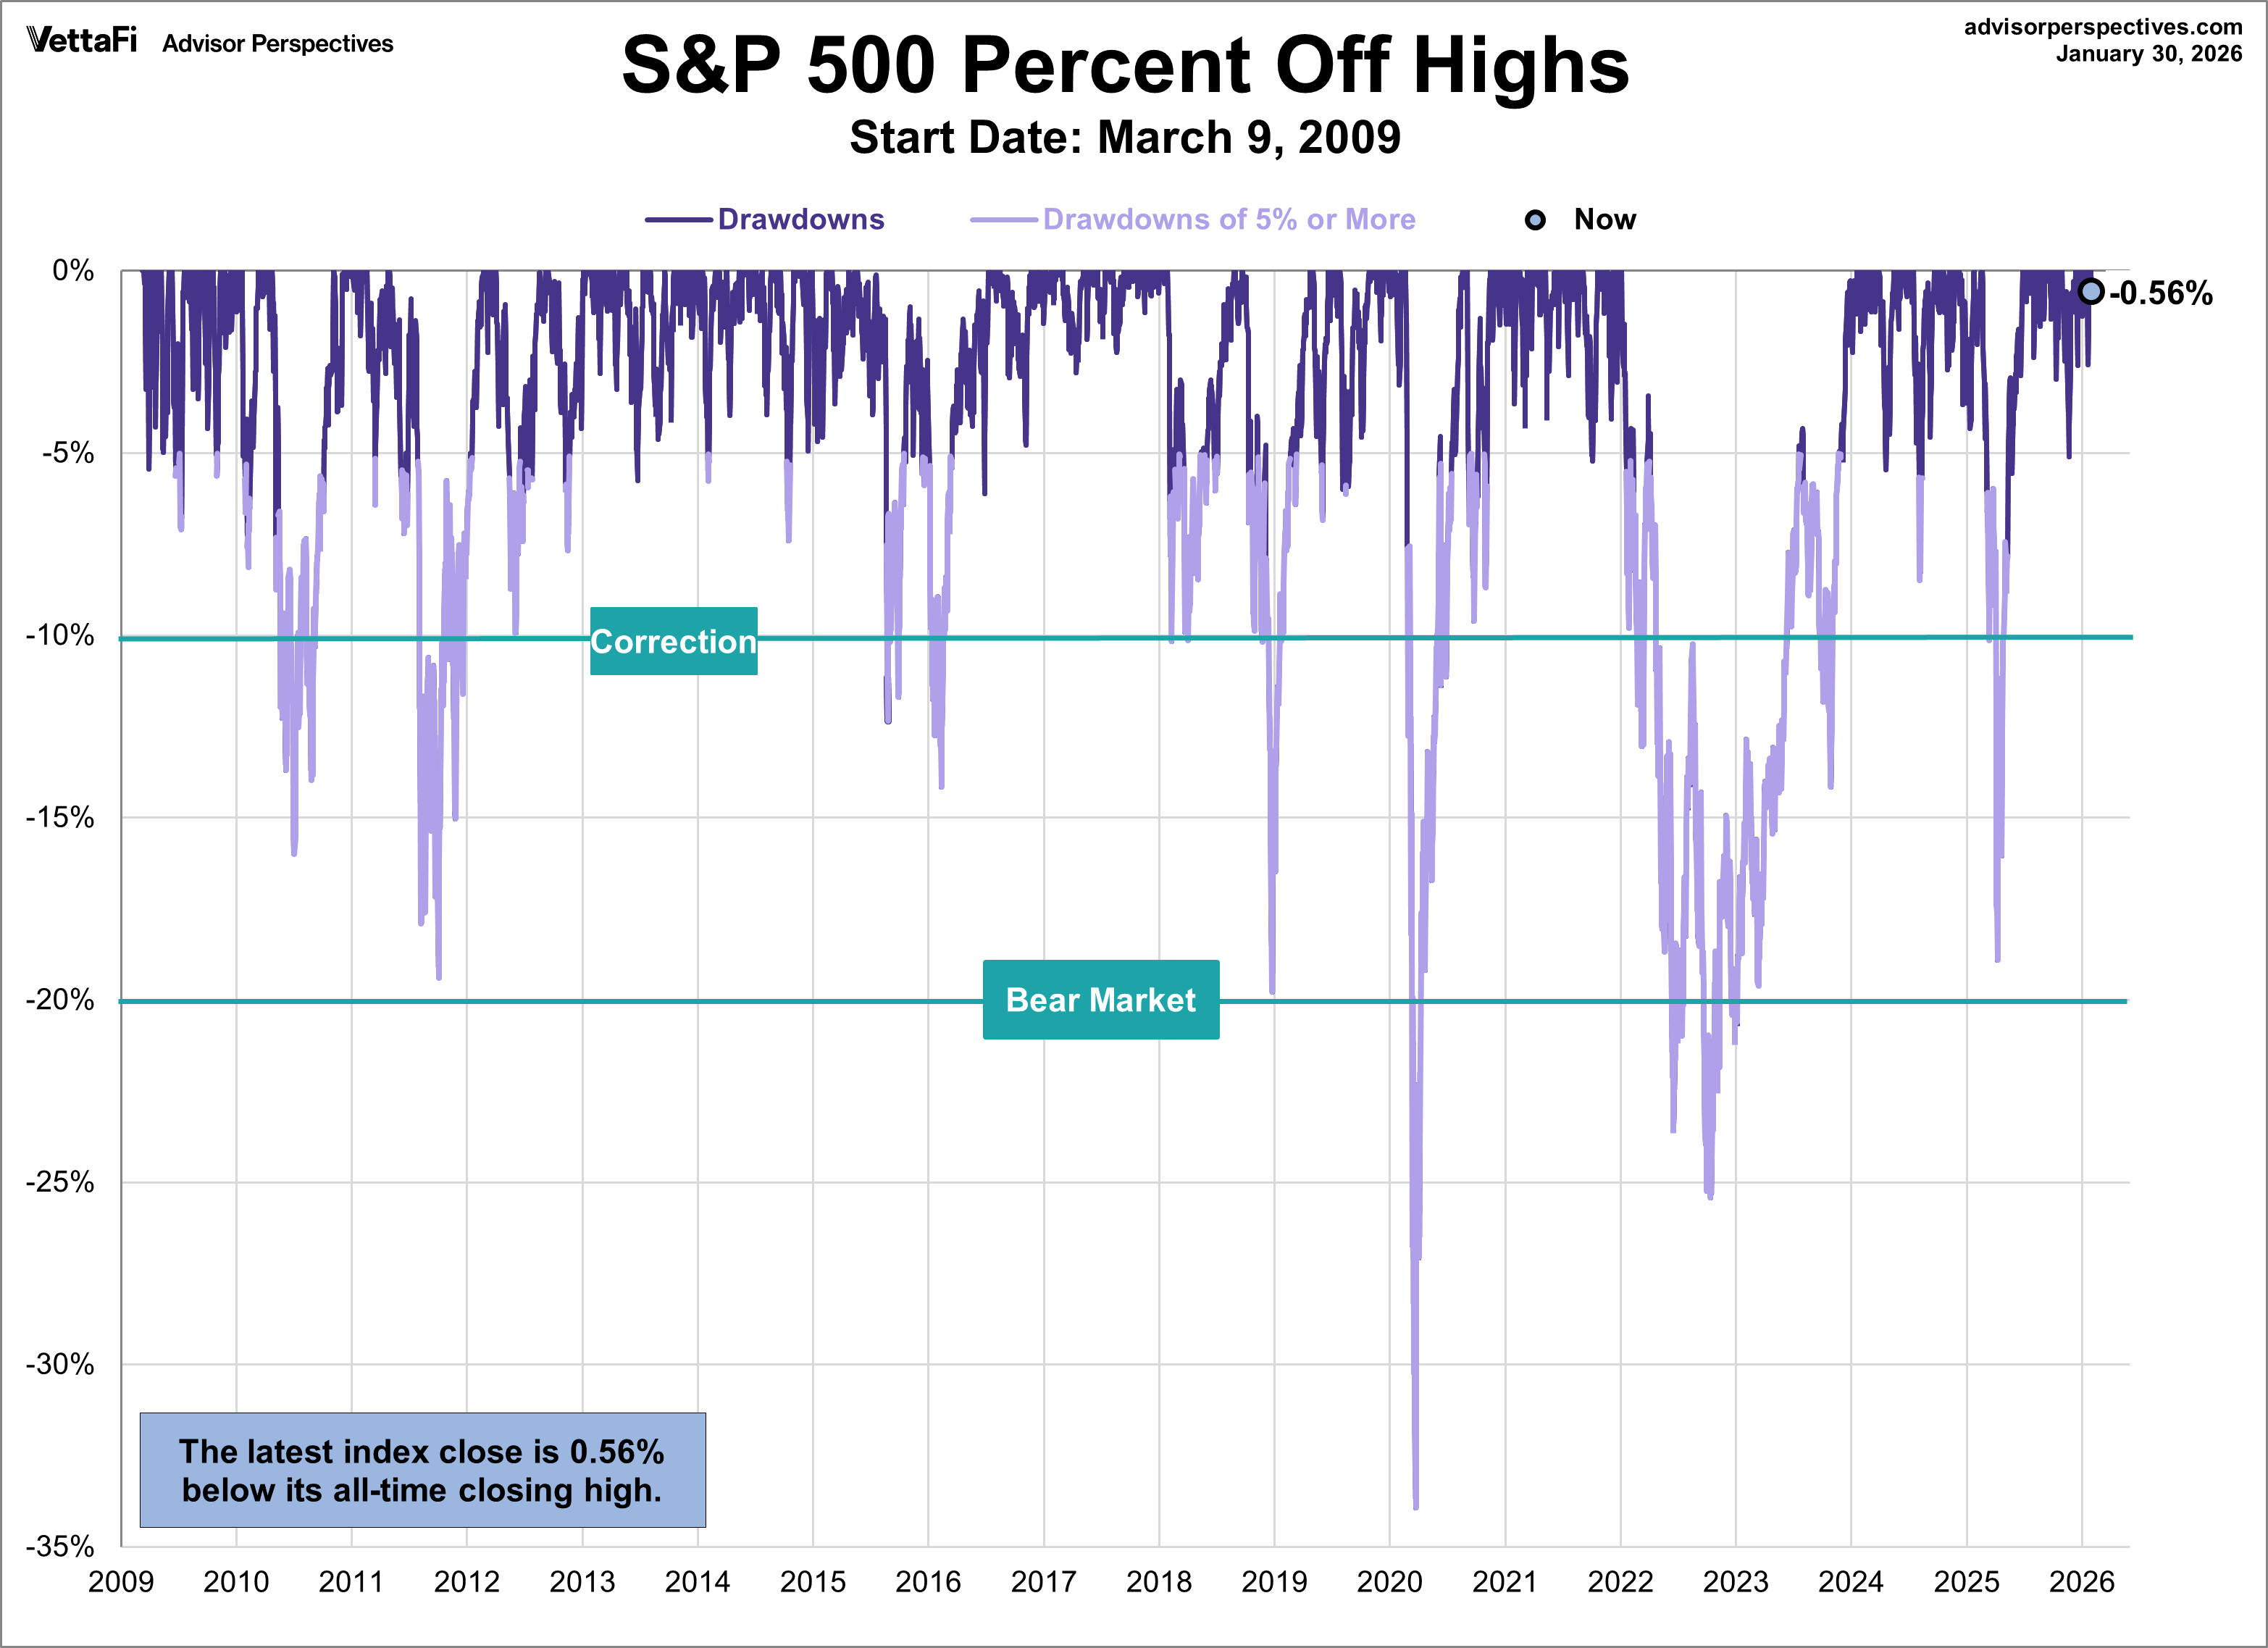
A Perspective on Drawdowns
Here's a snapshot of selloffs since the 2009 trough.
Here is a more conventional log-scale chart with drawdowns highlighted.
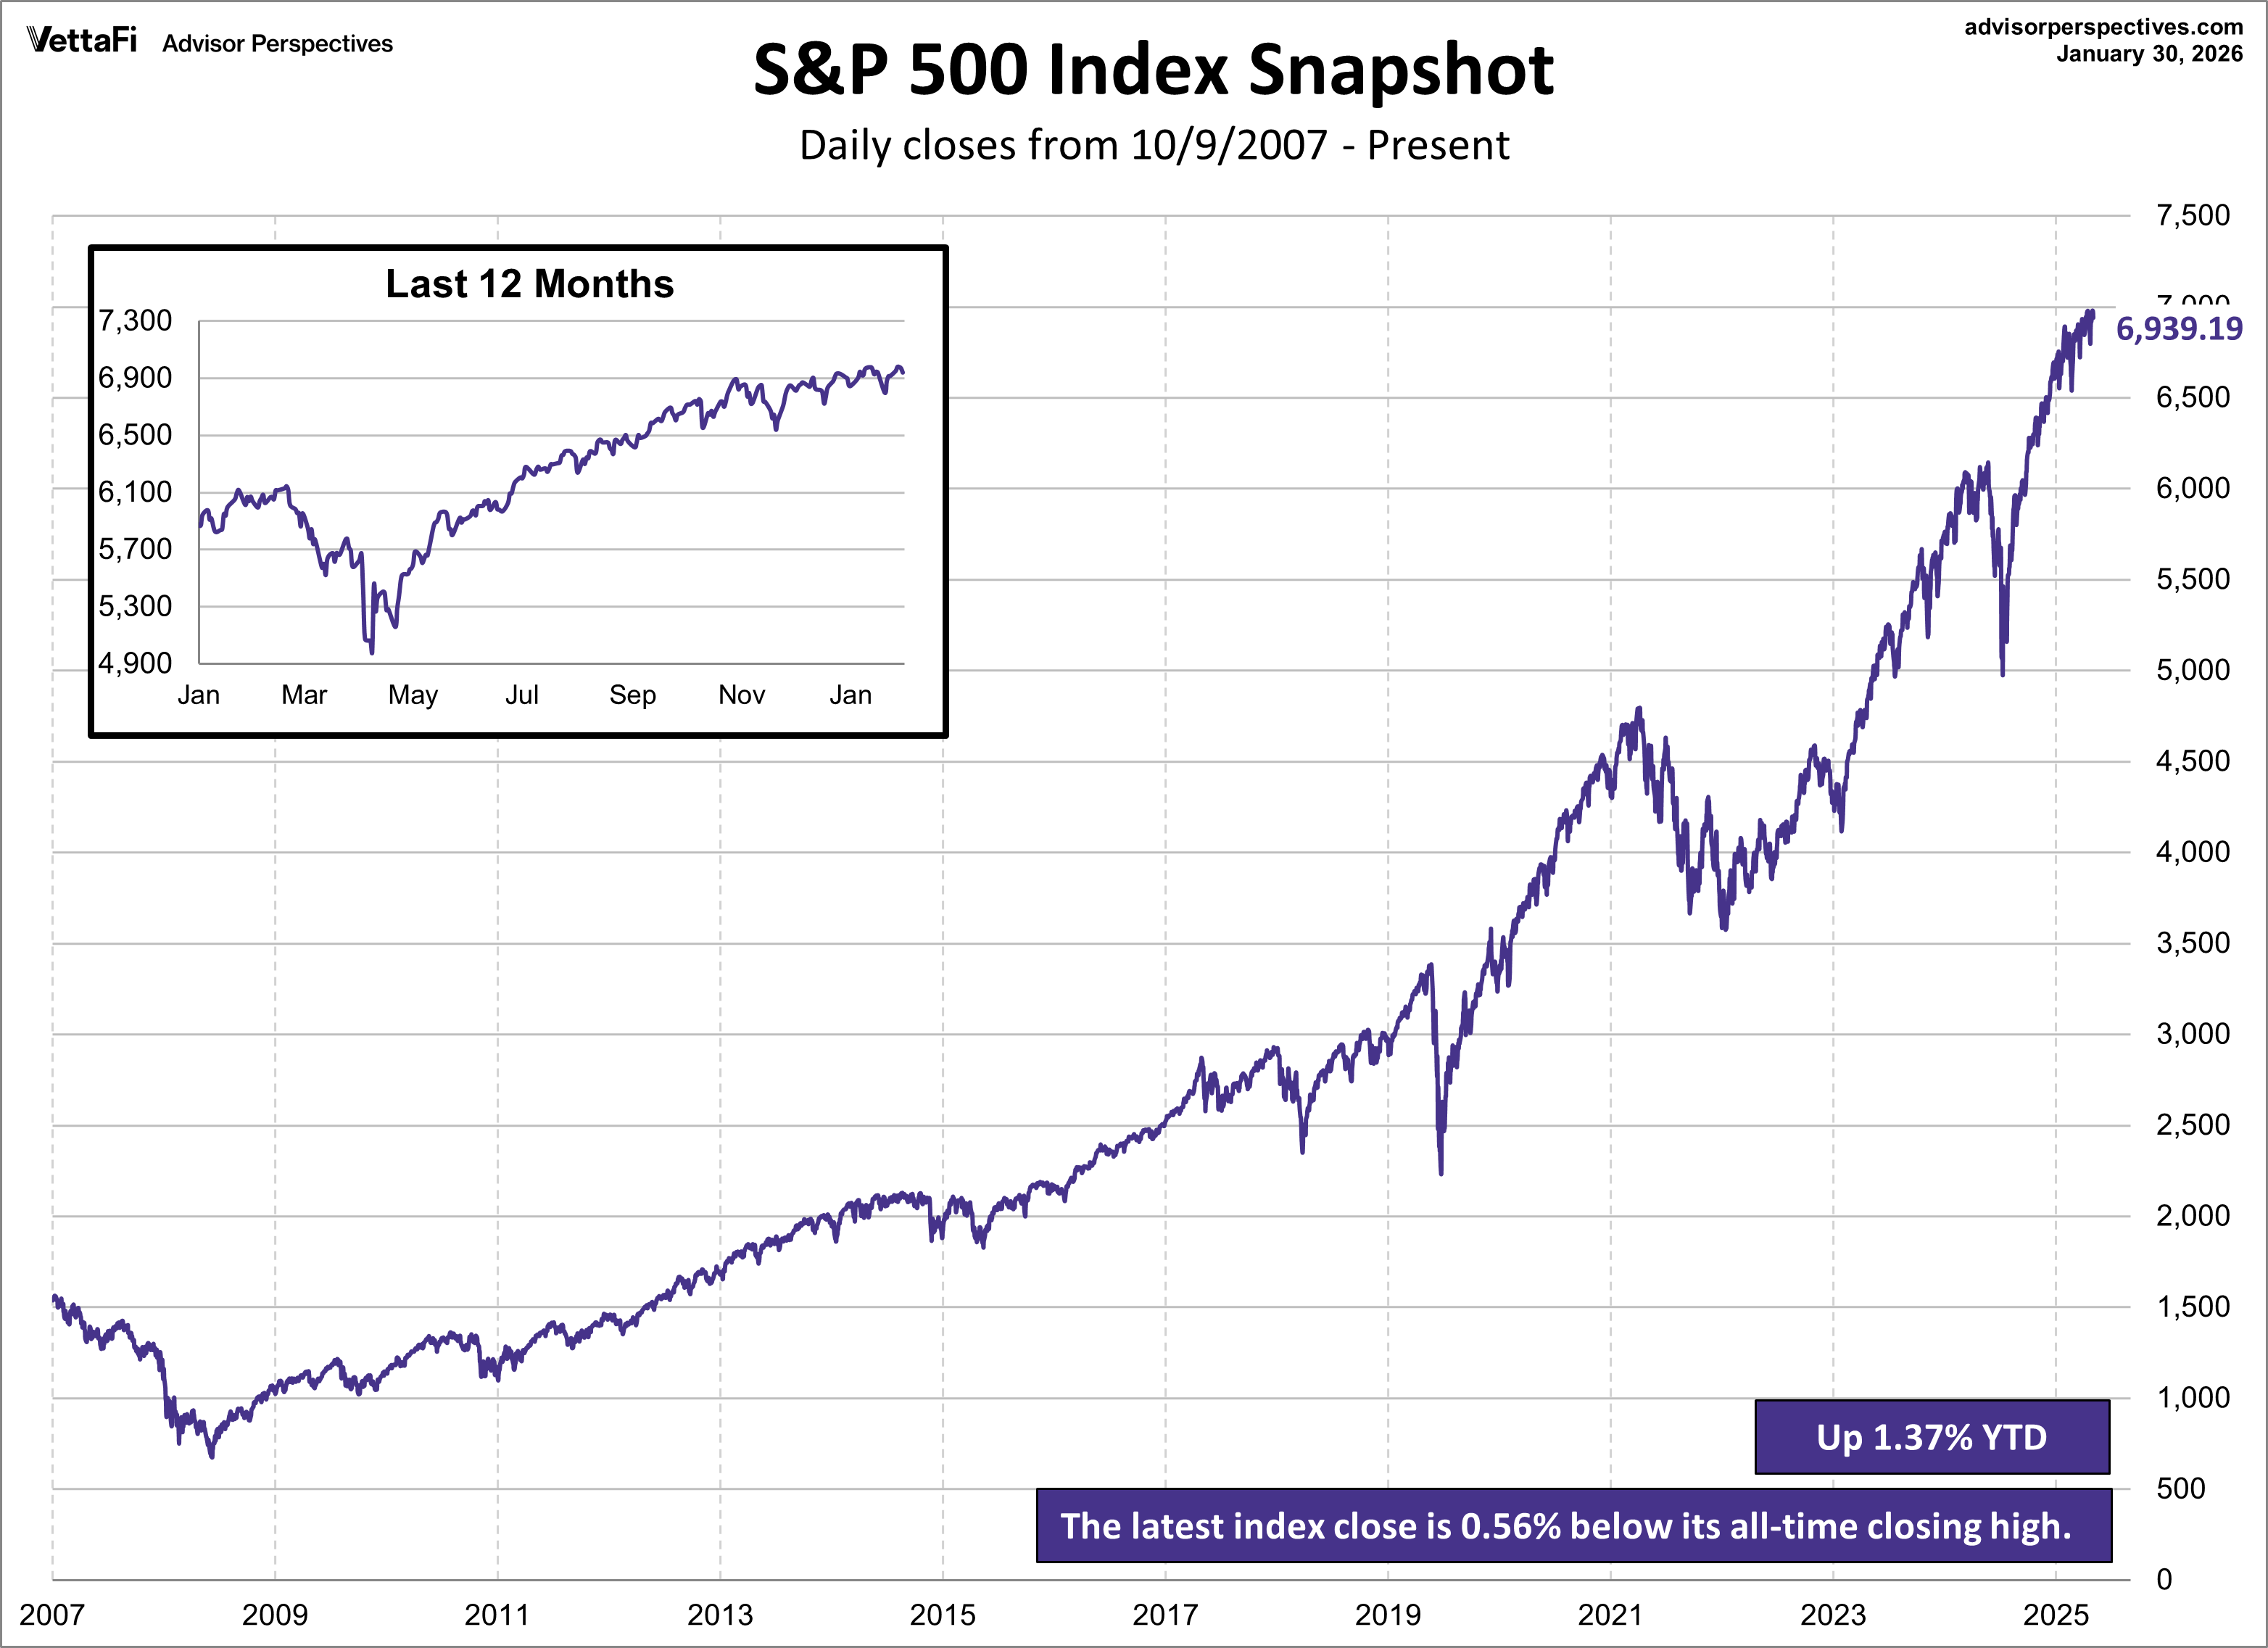
Here is a linear scale version of the same chart with the 50- and 200-day moving averages.

A Perspective on Volatility
For a sense of the correlation between the closing price and intraday volatility, the chart below overlays the S&P 500 since 2007 with the intraday price range. We've also included a 20-day moving average to help identify trends in volatility.




Comments
Log in or sign up to join the conversation.