
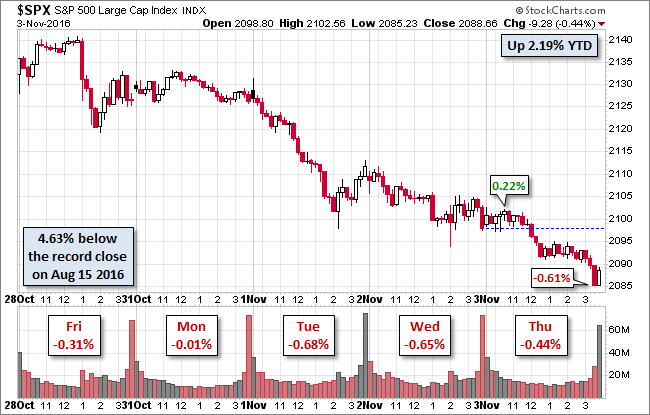
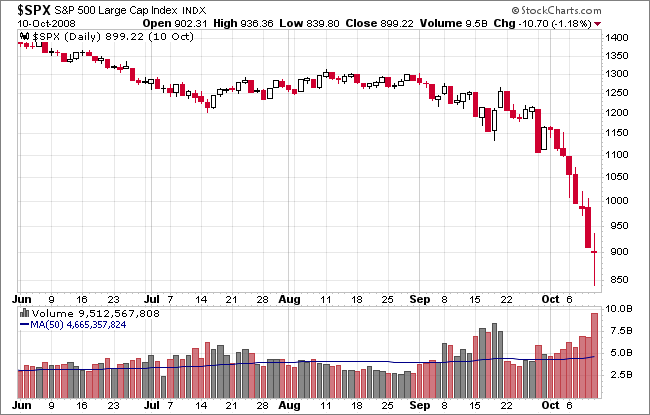
The S&P 500 posted another modest loss, extending its current selloff to eight sessions. The index opened fractionally higher and traded in a narrow range until the lunch hour, when it sold off to a narrow afternoon range in the shallow red. It then sank lower in the final hour to its -0.61% intraday low. Some buying in the final 15 minutes trimmed the loss to -0.44%. The eight-day decline is 2.91%. As we mentioned yesterday, the last time we had an eight-day rout was in October 2008. But the size of that selloff was a gut-wrenching -22.80%.
Should the S&P 500 extend the selloff to nine days, we'd have to go back nearly 36 years to December of 1980 for the most recent example ... a nine-day decline of 9.37%.
The 10-year Note closed the session at 1.82%, up one BP from the previous close.
Here is a snapshot of past five sessions in the S&P 500.
(Click on image to enlarge)
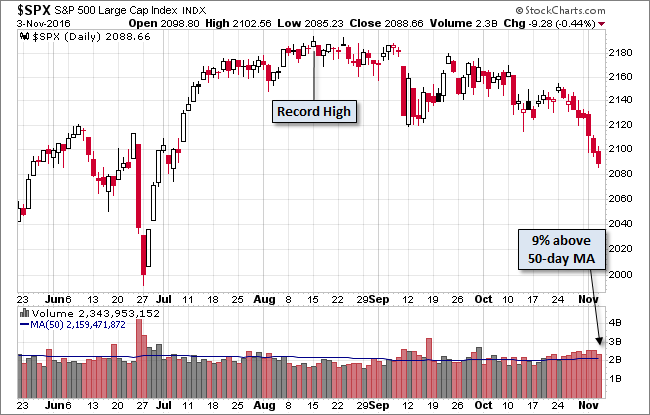
Here's a daily chart of the index. Trading volume was unremarkable, certainly not reflecting any sort of panic. However the VIX closed above the 20 "fear" benchmark at 22.14.
(Click on image to enlarge)
For an interesting comparison, check out the volume on the savage e-ght-day selloff in 2008.
(Click on image to enlarge)
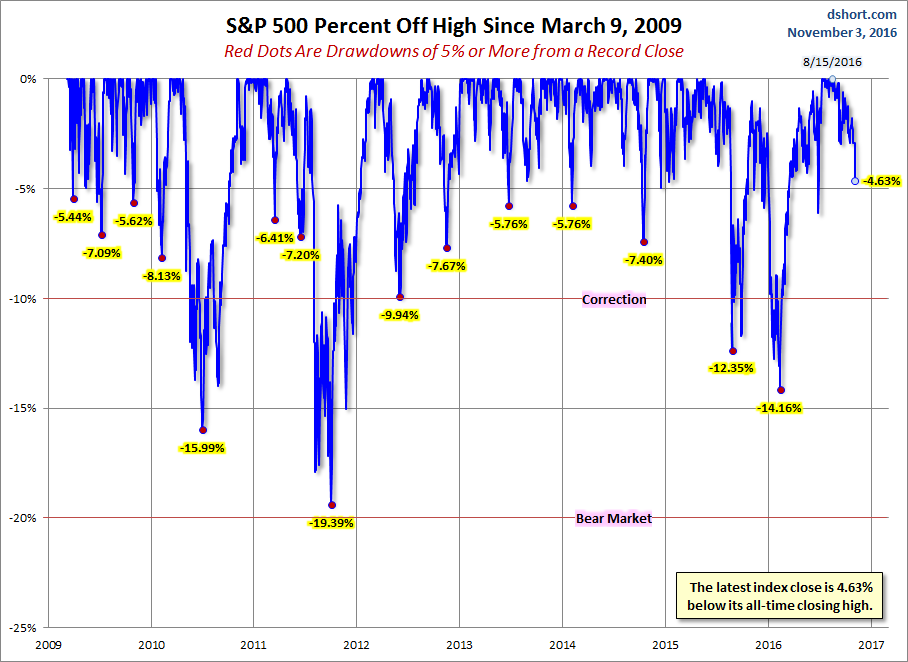
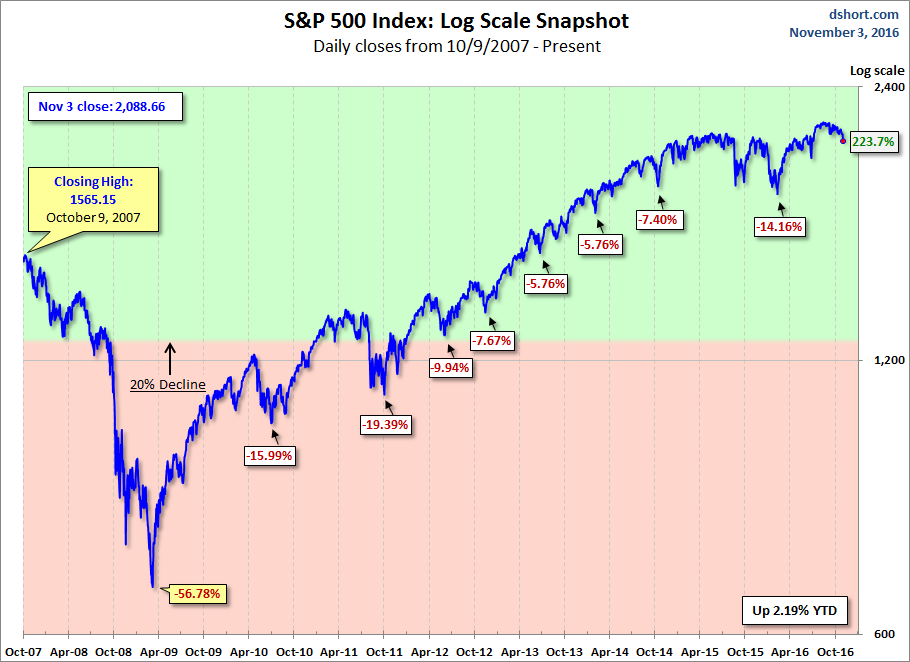
A Perspective on Drawdowns
Here's a snapshot of selloffs since the 2009 trough.
(Click on image to enlarge)
Here is a more conventional log-scale chart with drawdowns highlighted.
(Click on image to enlarge)
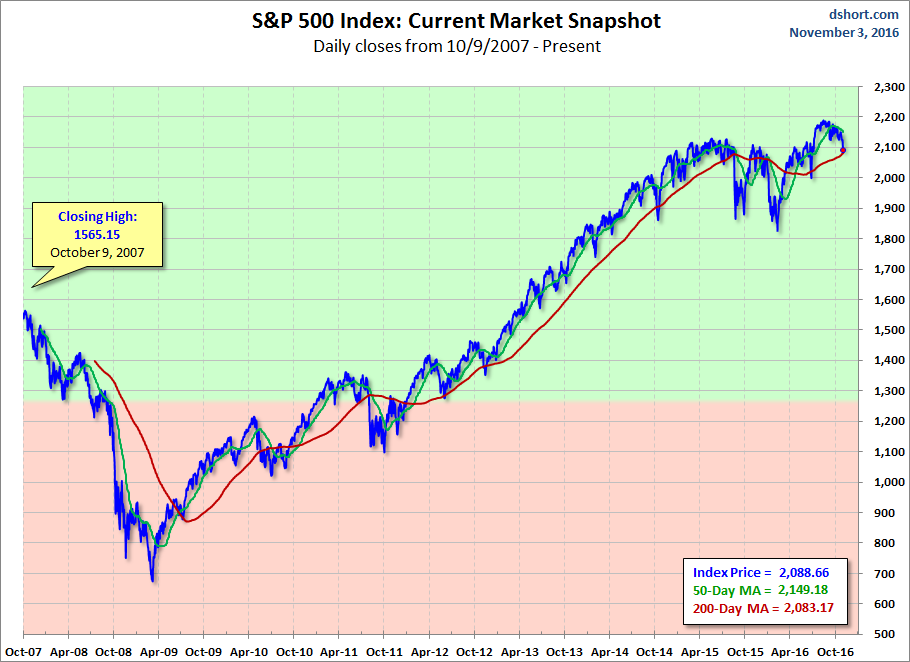
Here is a linear scale version of the same chart with the 50- and 200-day moving averages.
(Click on image to enlarge)
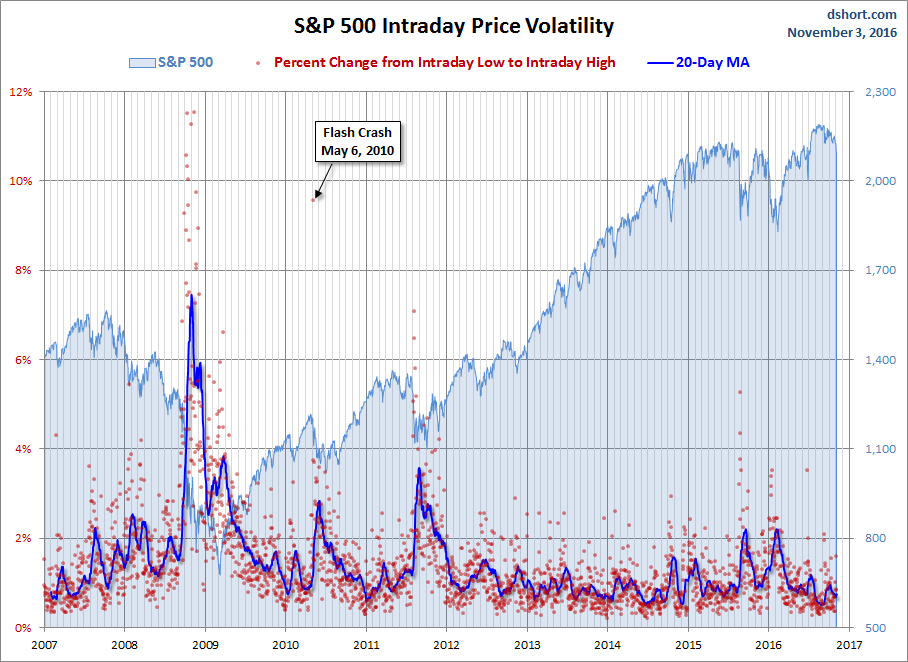
A Perspective on Volatility
For a sense of the correlation between the closing price and intraday volatility, the chart below overlays the S&P 500 since 2007 with the intraday price range. We've also included a 20-day moving average to help identify trends in volatility.
(Click on image to enlarge)


Comments
Log in or sign up to join the conversation.