

Global equity markets were mixed today, but the major US indexes posted gains. Our benchmark S&P 500 vacillated at the open and then rose to a narrow trading through the rest of the session, closing with a 0.24% gain a bit below its 0.31% intraday high in the final hour. The index appears to be dealing with some short-term resistance in the vicinity of last Thursday's intraday high. Today's intraday range was the fourth narrowest of the 136 market days so far in 2016.
The yield on the 10-year note fell one basis point to close at 1.59%.
Here is a snapshot of past five sessions in the S&P 500.

Here is a daily chart of the S&P 500. The preliminary read on rading volume was 19% below its 50-day moving average.

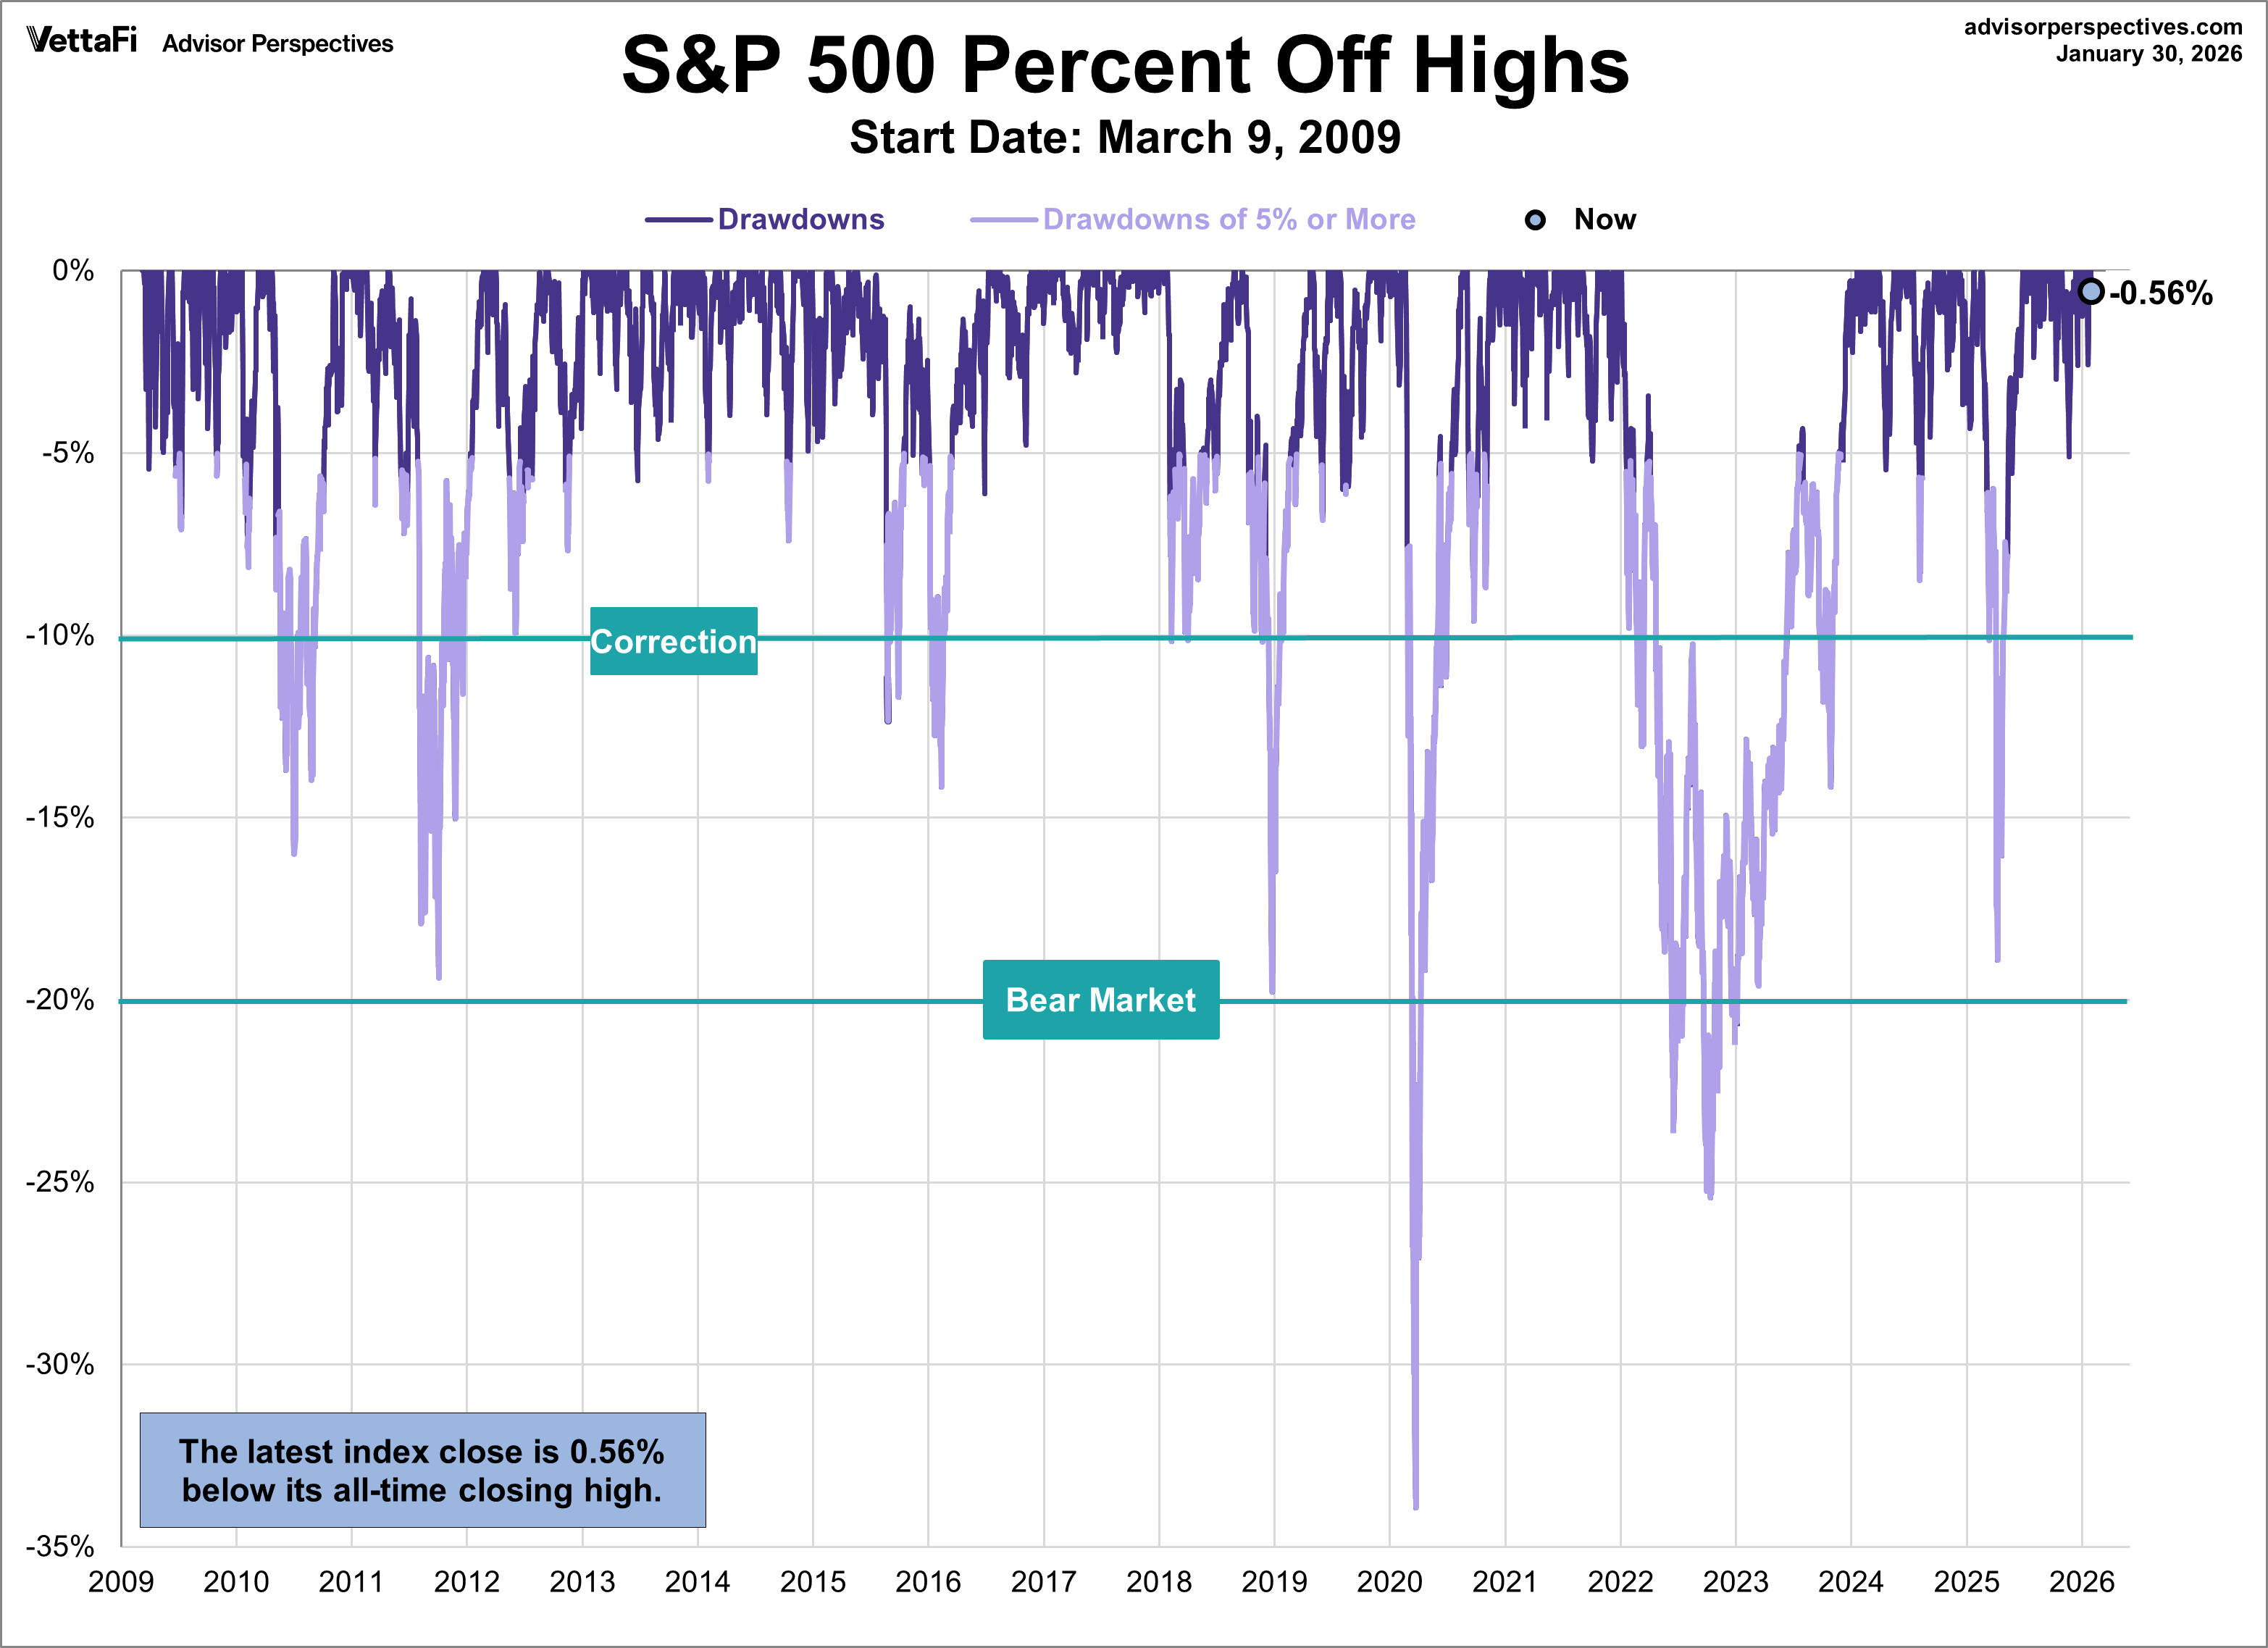
A Perspective on Drawdowns
Here's a snapshot of selloffs since the 2009 trough.
Here is a more conventional log-scale chart with drawdowns highlighted.
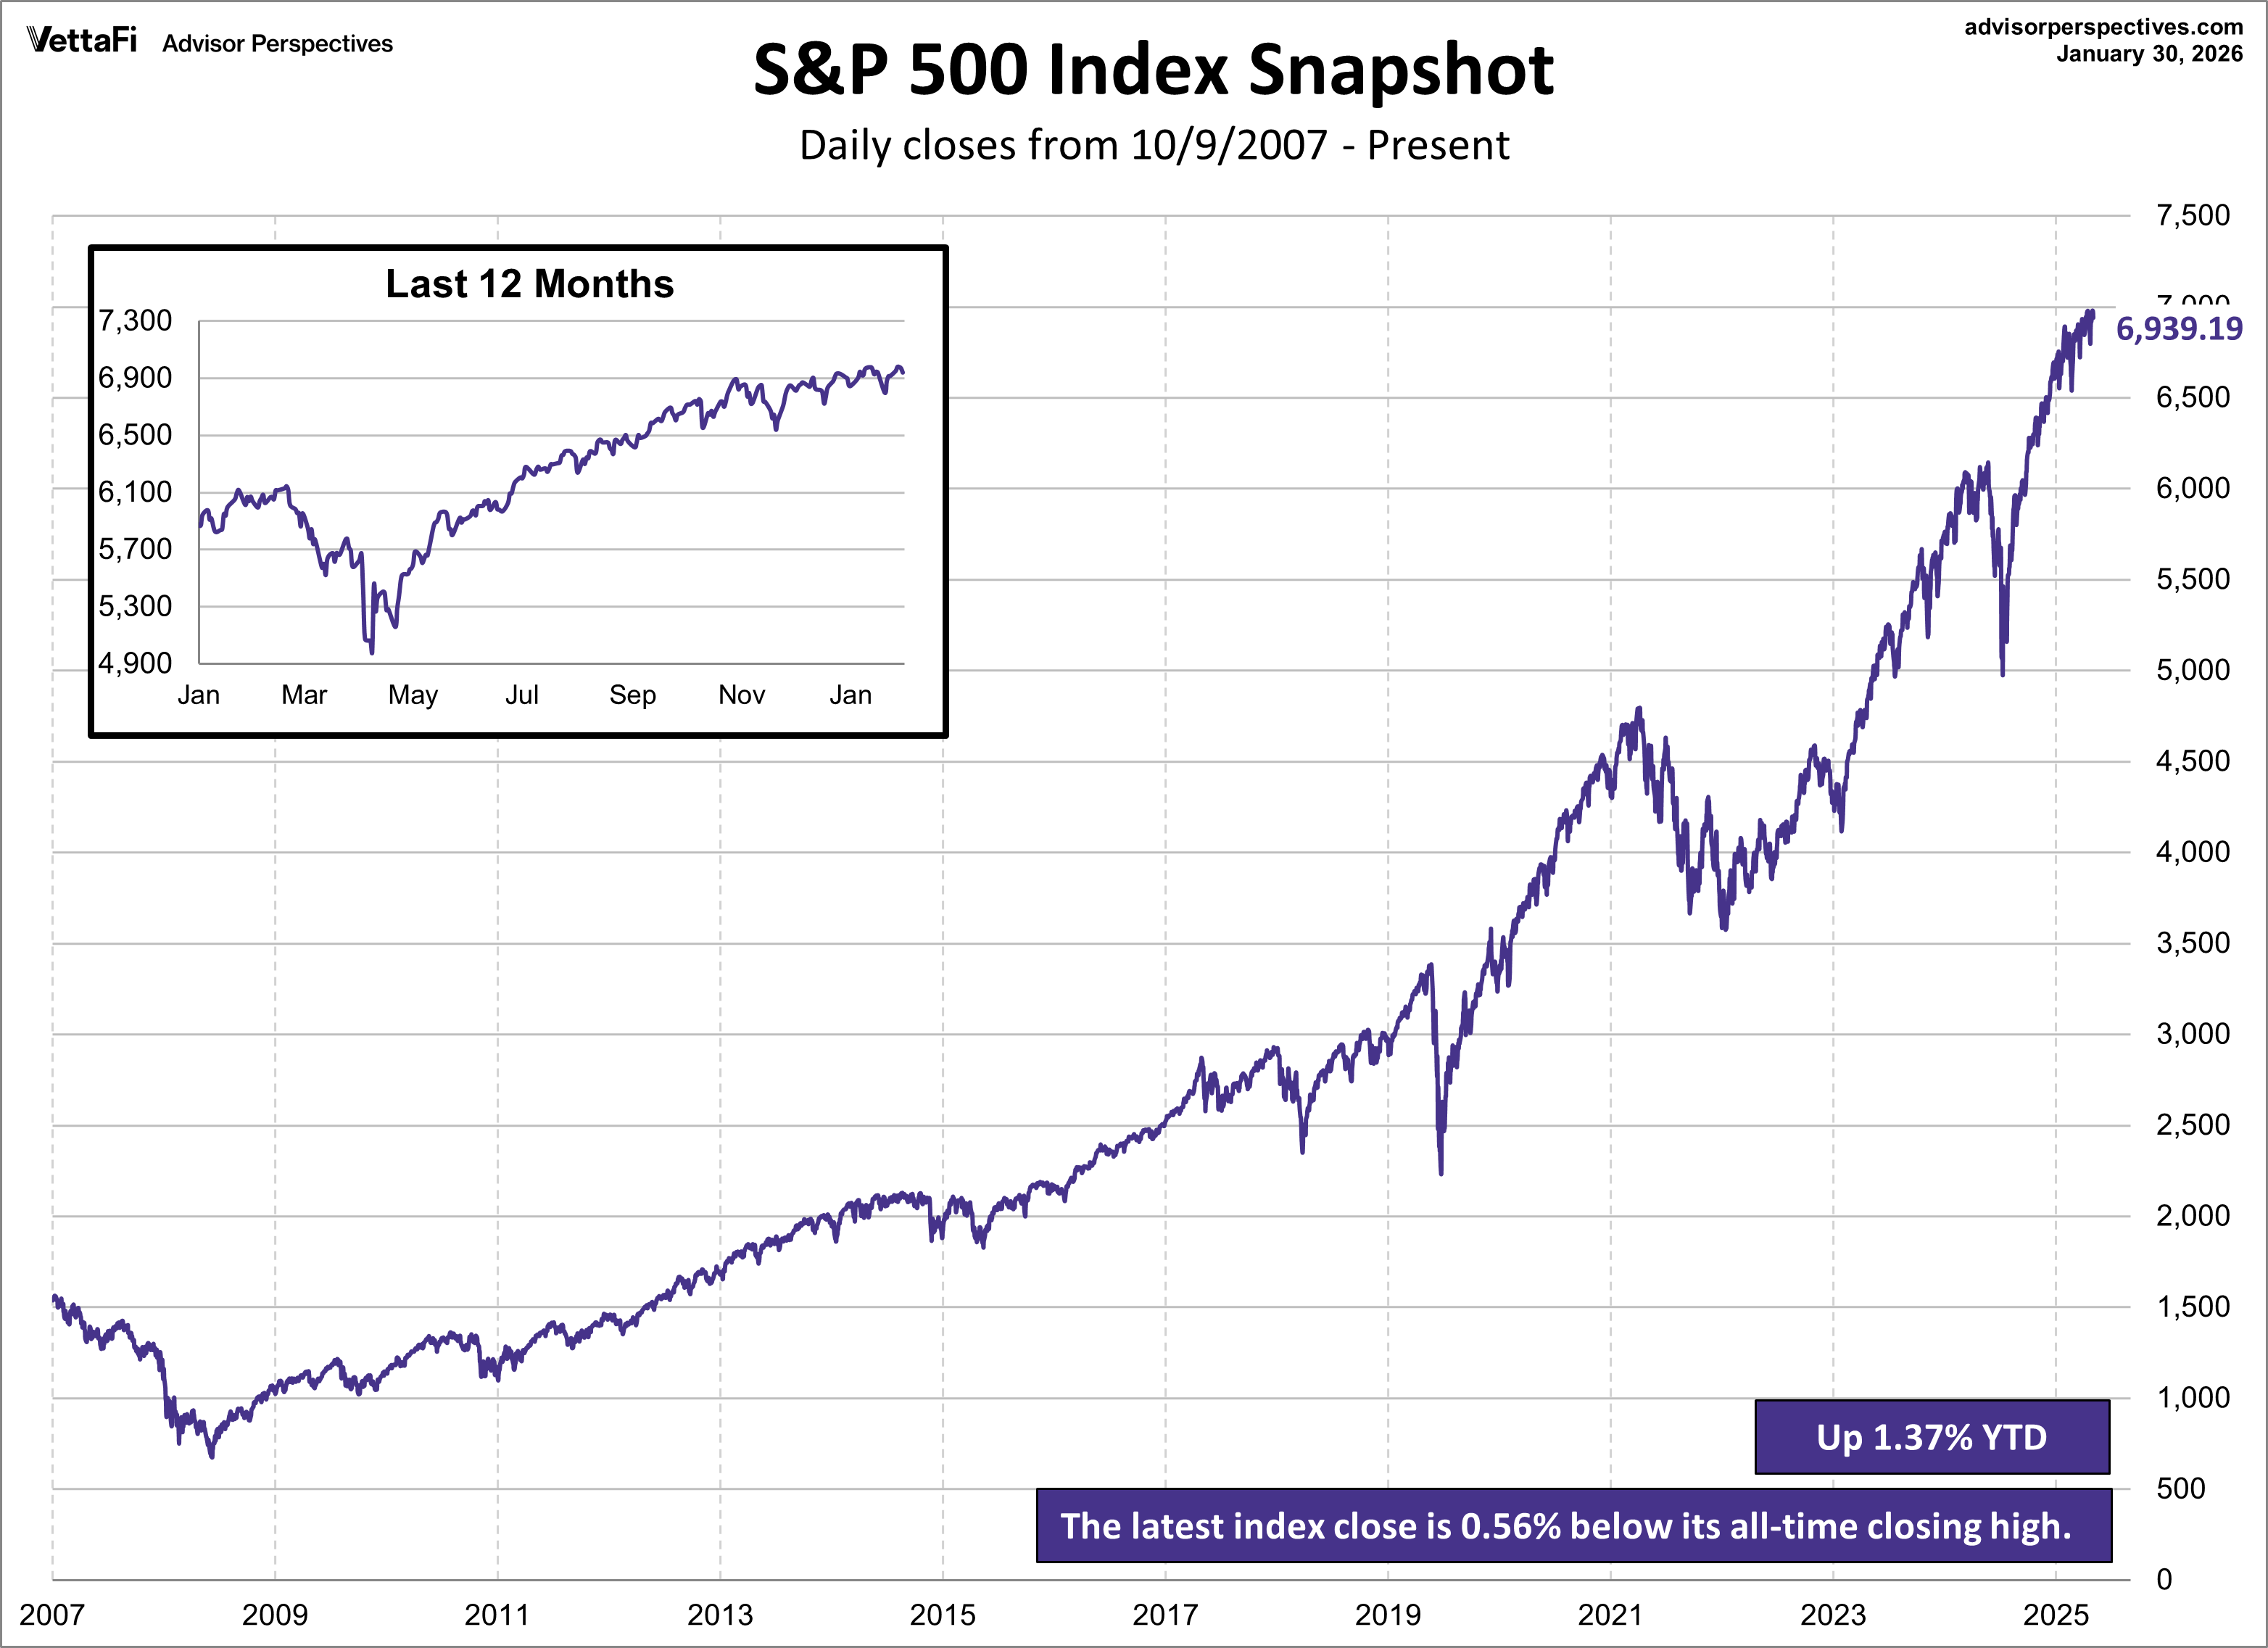
Here is a linear scale version of the same chart with the 50- and 200-day moving averages.

A Perspective on Volatility
For a sense of the correlation between the closing price and intraday volatility, the chart below overlays the S&P 500 since 2007 with the intraday price range. We've also included a 20-day moving average to help identify trends in volatility.




Comments
Log in or sign up to join the conversation.