

Today was light on economic news, and our benchmark S&P 500 essentially went nowhere, ending the session with a fractional loss. The index hit its -0.36% intraday low shortly after the open and zigzagged through the session in a narrowing range to its -0.06% close. Economic data will pick up as the week progresses: home sales tomorrow and Wednesday, Durable Goods and the start of Jackson Hole on Thursday, and the second estimate of GDP and Yellen's Jackson Hole speech on Friday. Stay tuned!
The yield on the 10-year note closed at at 1.55%, down three basis points from the previous close.
Here is a snapshot of past five sessions in the S&P 500.

Here is daily chart of the SPY ETF. Trading volume remains in summer-time vacation mode.

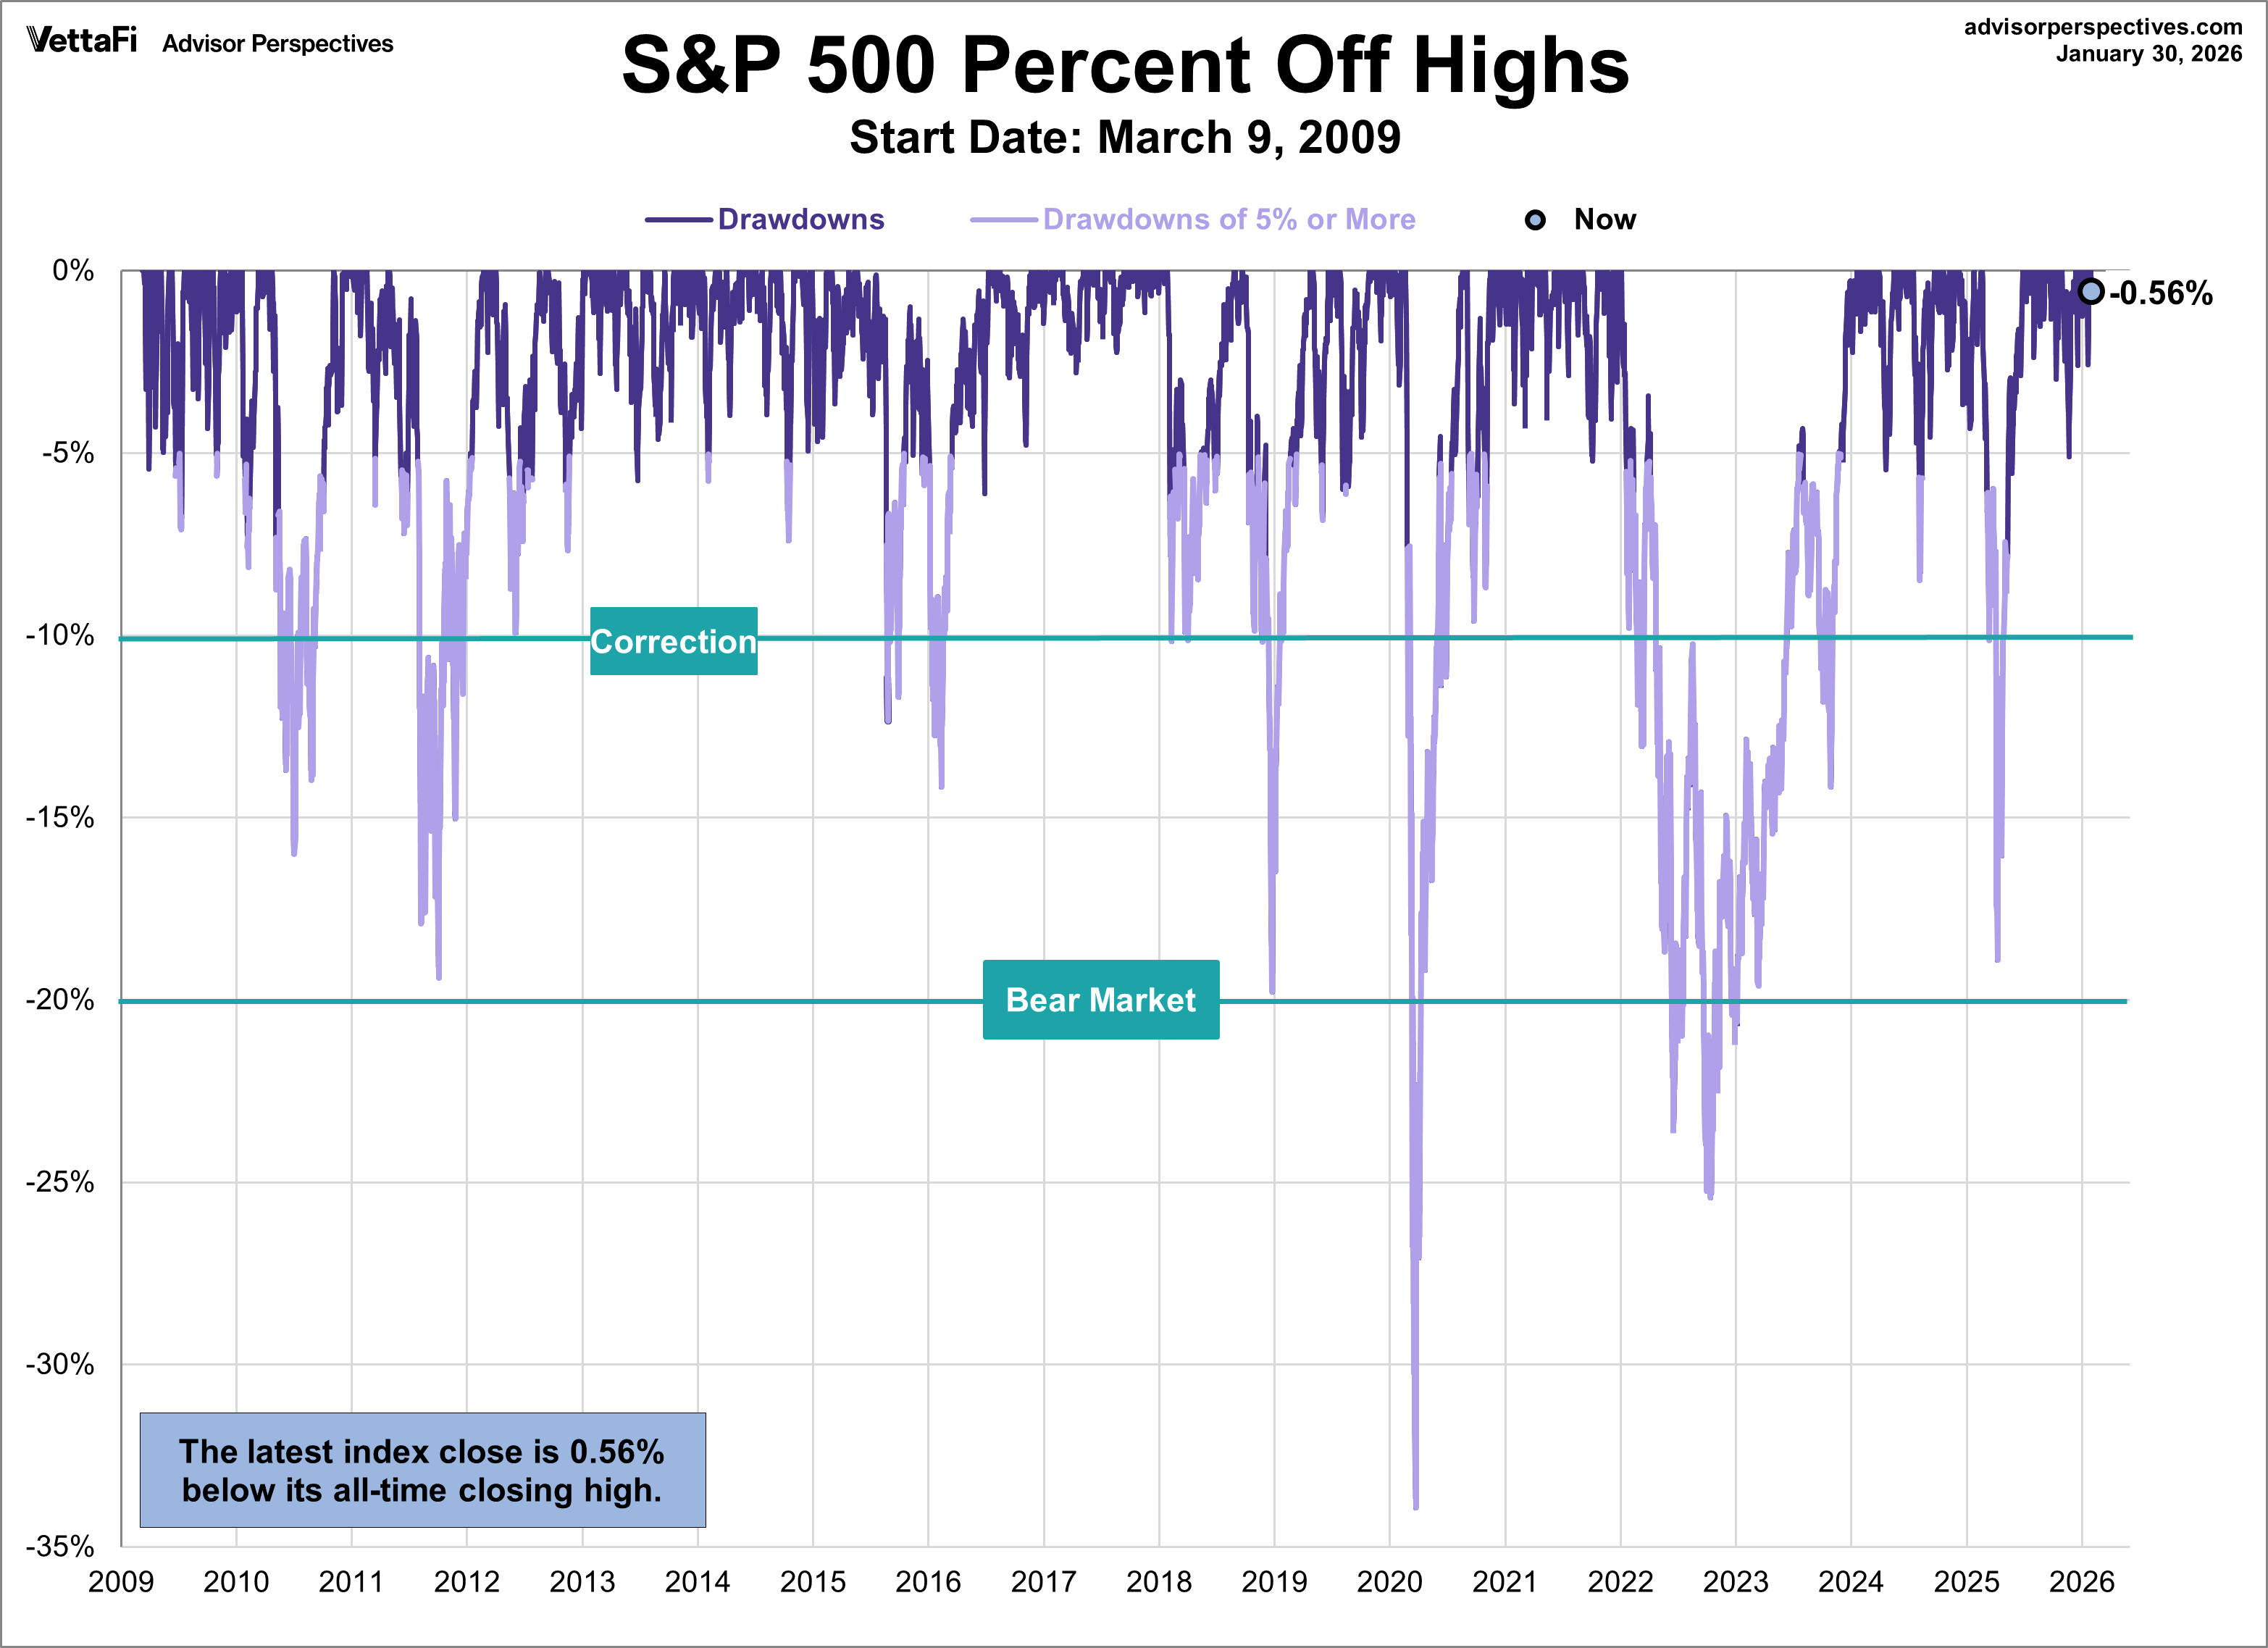
A Perspective on Drawdowns
Here's a snapshot of selloffs since the 2009 trough.
Here is a more conventional log-scale chart with drawdowns highlighted.
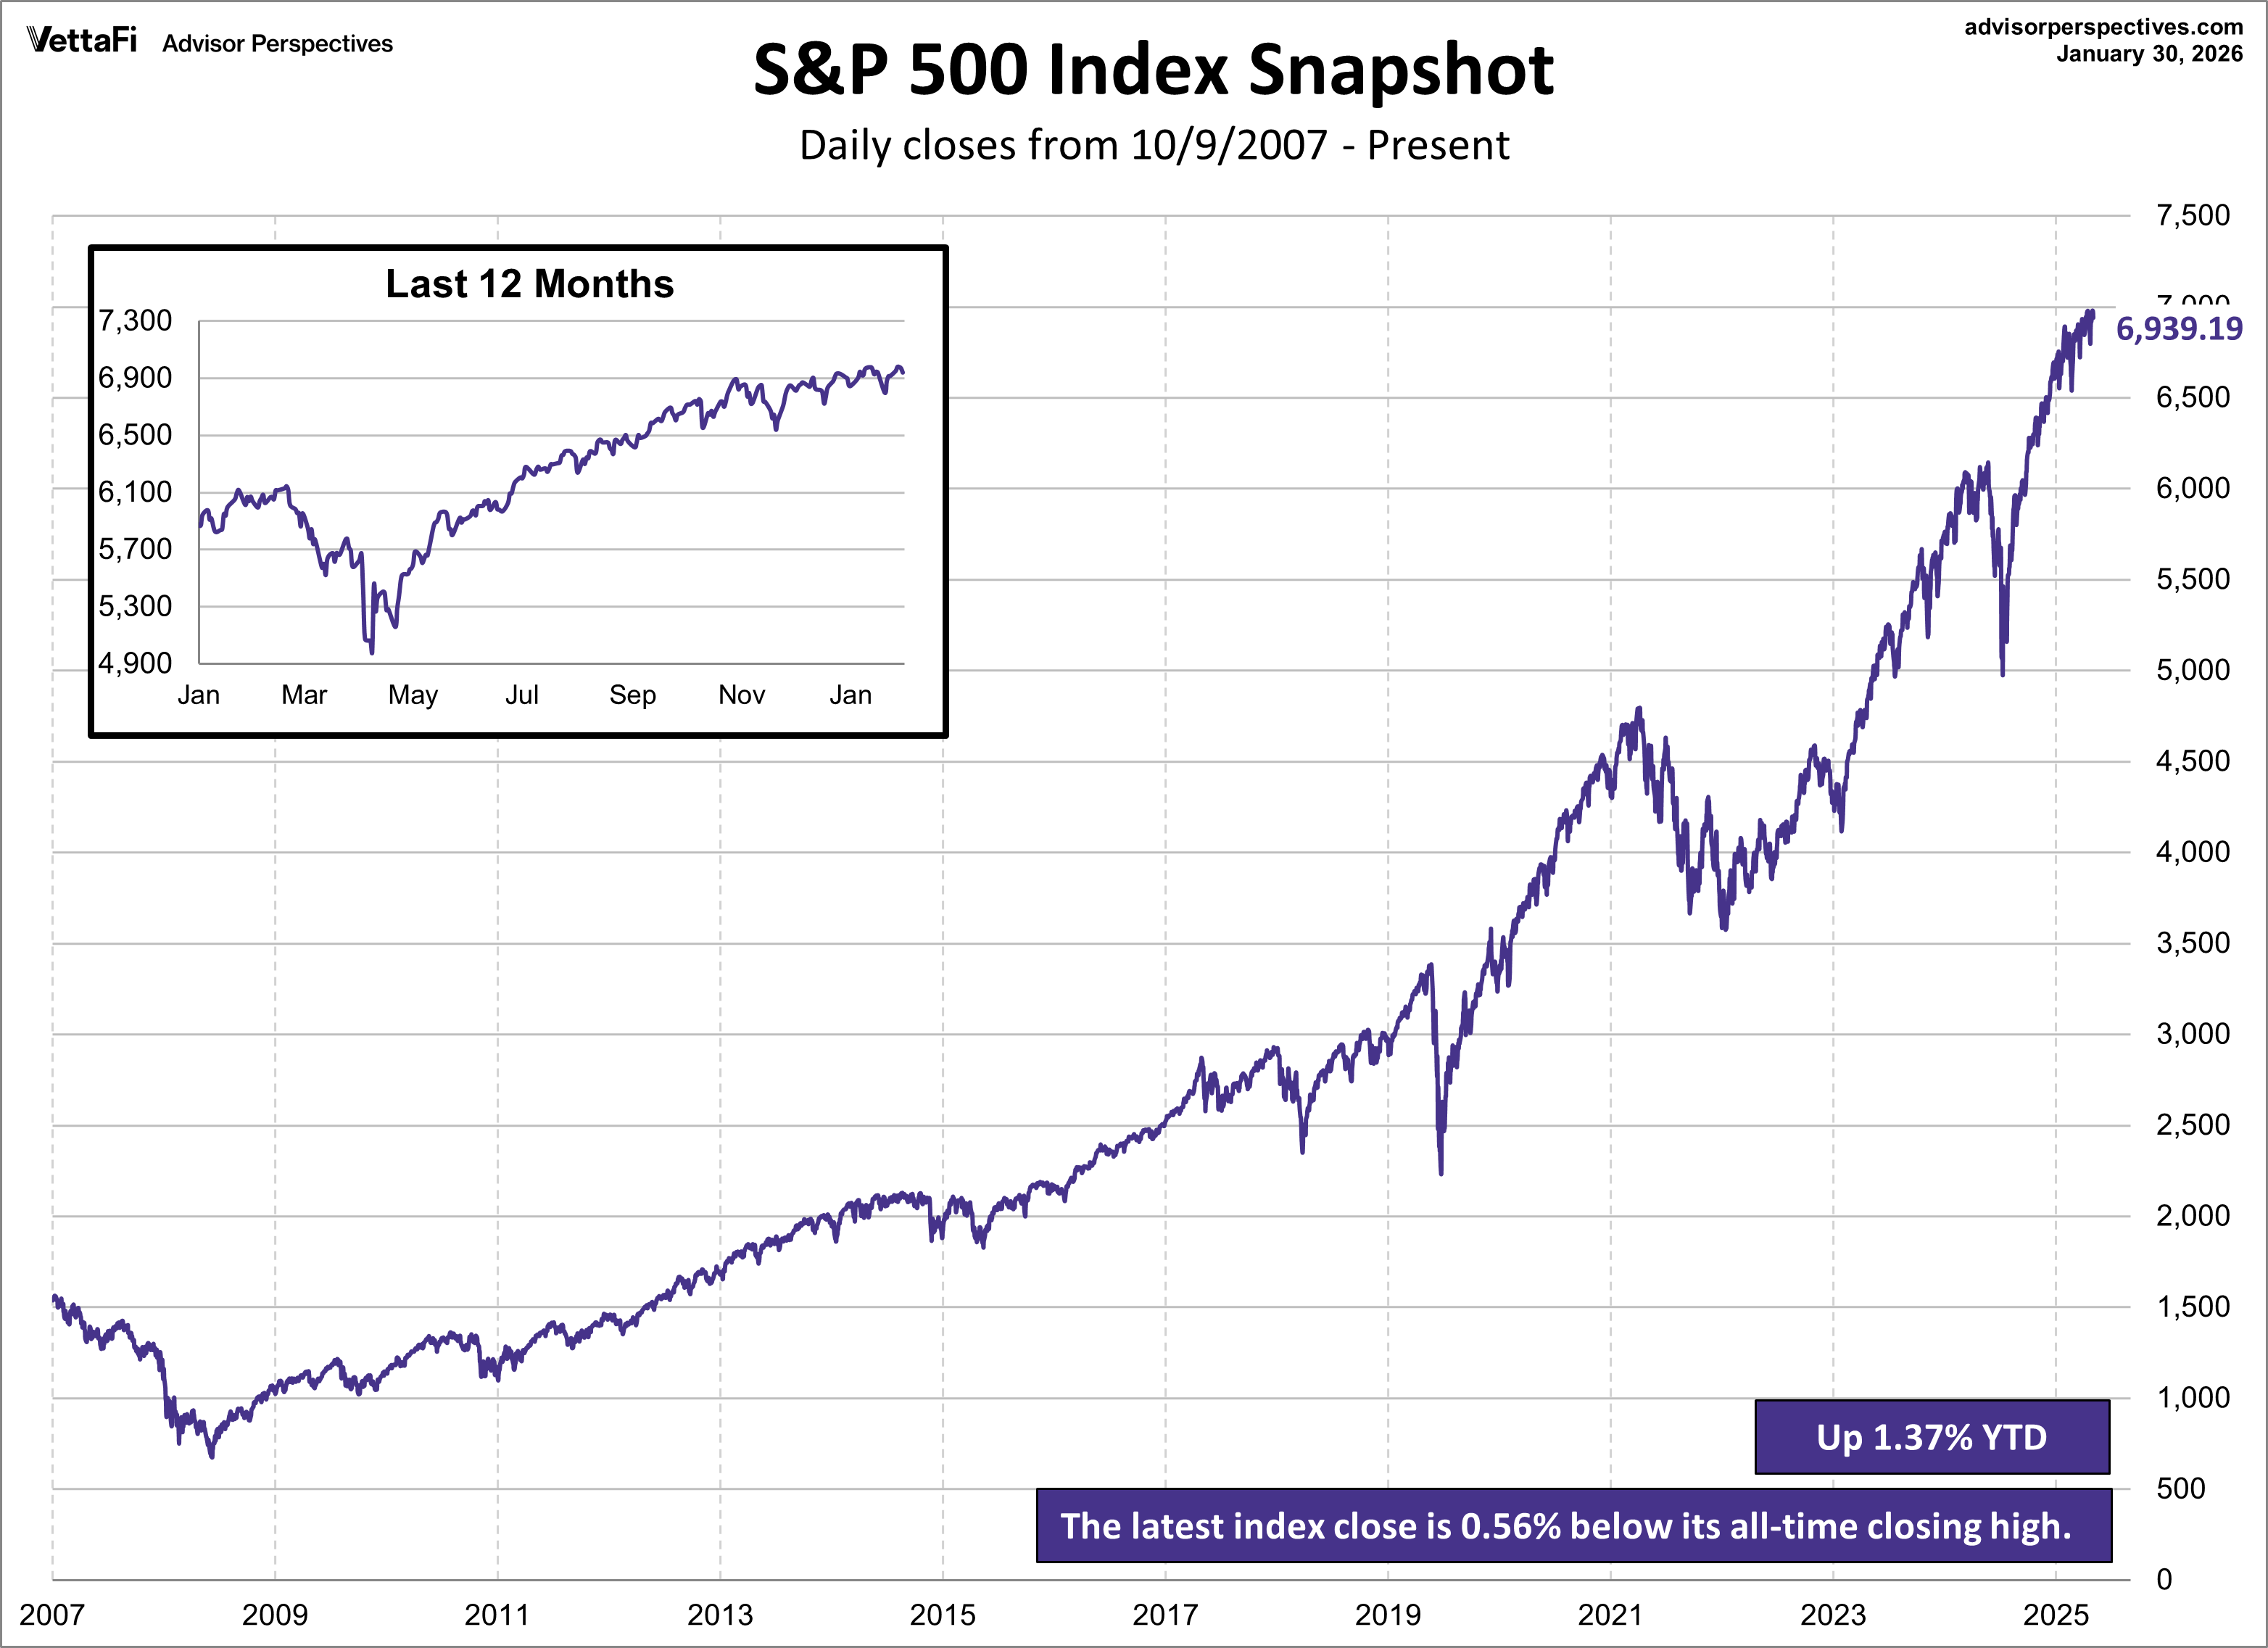
Here is a linear scale version of the same chart with the 50- and 200-day moving averages.

A Perspective on Volatility
For a sense of the correlation between the closing price and intraday volatility, the chart below overlays the S&P 500 since 2007 with the intraday price range. We've also included a 20-day moving average to help identify trends in volatility.




Comments
Log in or sign up to join the conversation.