

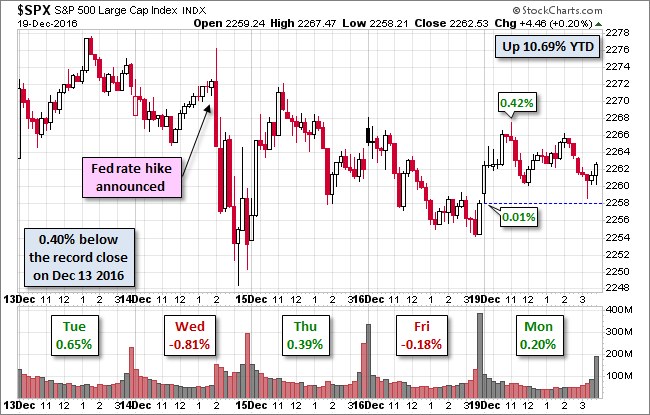
The S&P 500 began the week with a modest gain of 0.20%, not quite half the gain at its 0.42% intraday high in the late morning. Aside from the global stress of terrorism in Ankara with the assassination of Russia's ambassador to Turkey and what's being investigated as a terrorist act in Berlin with multiple casualties, the main event for markets was Janet Yellen's mid-year commencement speech at the University of Baltimore. Her main theme was an upbeat view of the jobs market, an appropriate message for an audience of college degree recipients.
Here is a snapshot of the past five sessions.
(Click on image to enlarge)
The yield on the 10-year note closing at 2.54%, down six BPs from the previous close.
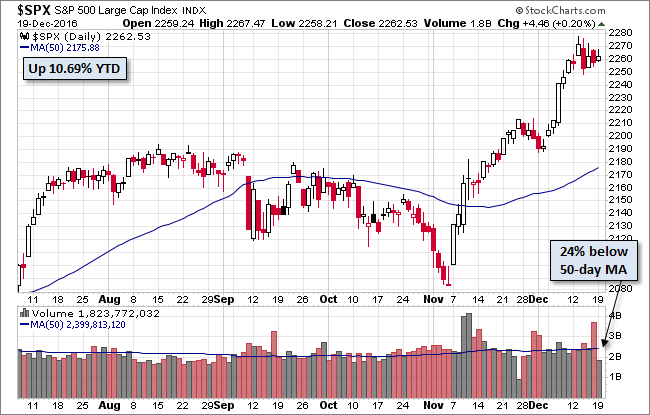
Here is daily chart of the index. Apart from the shorten session on Friday following the Thanksgiving holiday, the initial tally of trading volume was the lowest since October 17th, well before the presidential election.
(Click on image to enlarge)
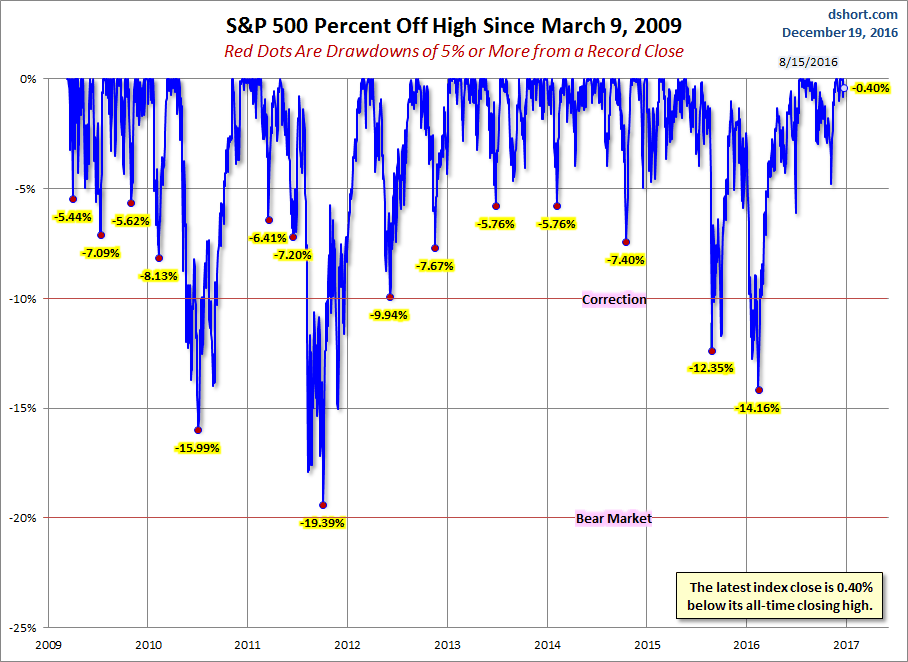
A Perspective on Drawdowns
Here's a snapshot of selloffs since the 2009 trough.
(Click on image to enlarge)
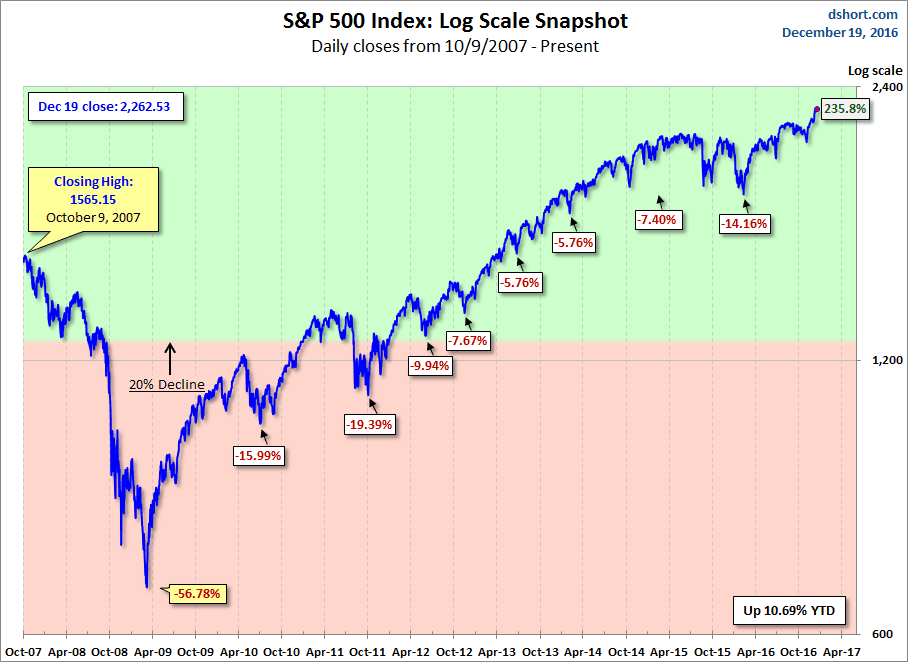
Here is a more conventional log-scale chart with drawdowns highlighted.
(Click on image to enlarge)
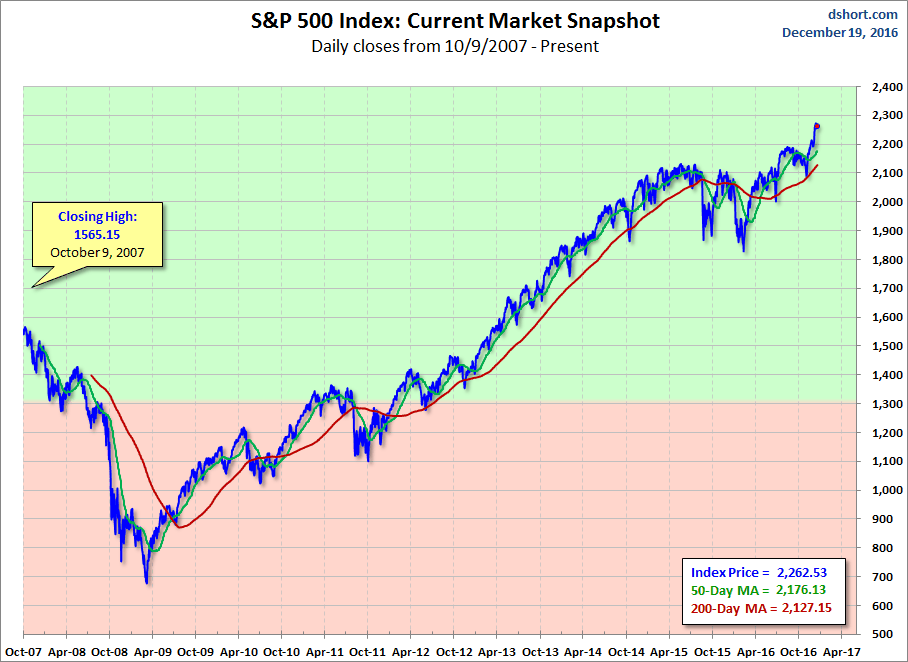
Here is a linear scale version of the same chart with the 50- and 200-day moving averages.
(Click on image to enlarge)
A Perspective on Volatility
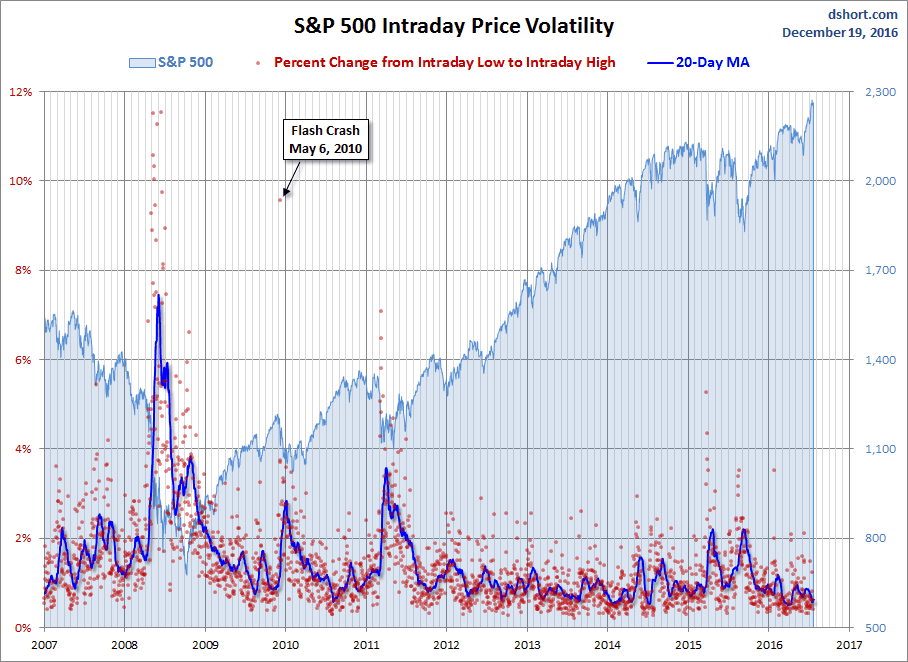
For a sense of the correlation between the closing price and intraday volatility, the chart below overlays the S&P 500 since 2007 with the intraday price range. We've also included a 20-day moving average to help identify trends in volatility.
(Click on image to enlarge)



Comments
Log in or sign up to join the conversation.