
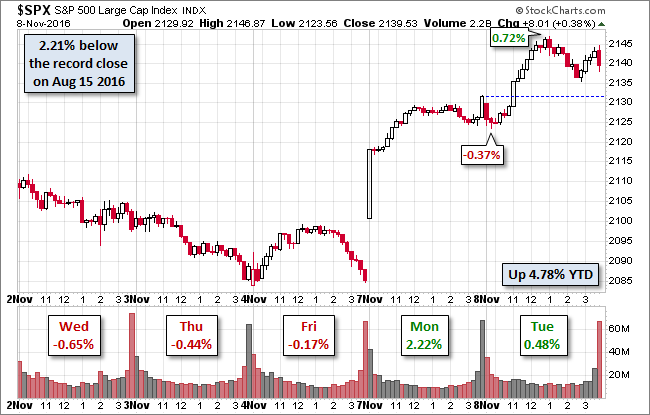
The Monday rally snapping a nine-day sell-off in S&P 500, the longest sell-off in nearly 36 years, continued today in a more subdued mode. The index opened lower, hitting its -0.37% intraday low in the first 30 minutes of the session and then rose steadily to its 0.72% midday high. It then zigzagged during the afternoon and closed with a modest 0.38% gain. In two days the S&P 500 has erased about 85% of the nine-day selloff. All eyes are now on the behavior of the markets when the election results are revealed.
The 10-year Note closed the session at 1.88%, up five BPs from the previous close.
Here is a snapshot of the past five sessions.
(Click on image to enlarge)
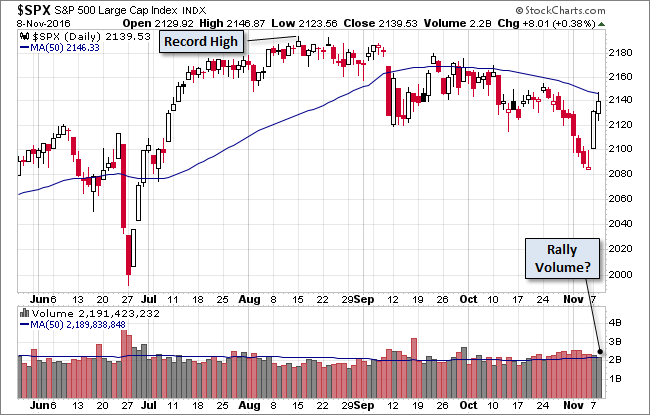
Here's a daily chart of the index. Rally volume remains unimpressive. Note that the 50-day moving average was an apparent point of resistance for today's trade.
(Click on image to enlarge)
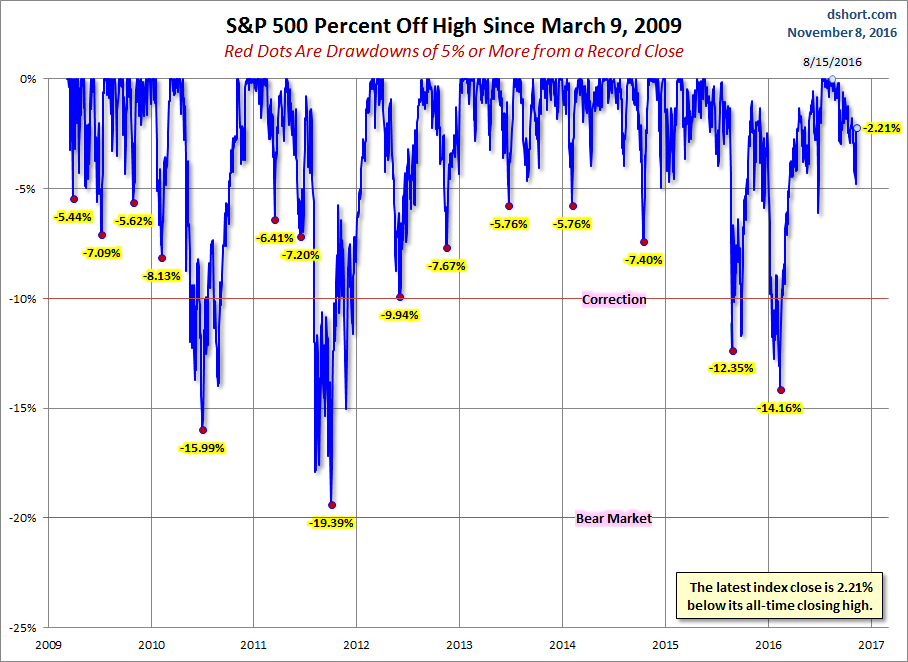
A Perspective on Drawdowns
Here's a snapshot of selloffs since the 2009 trough.
(Click on image to enlarge)
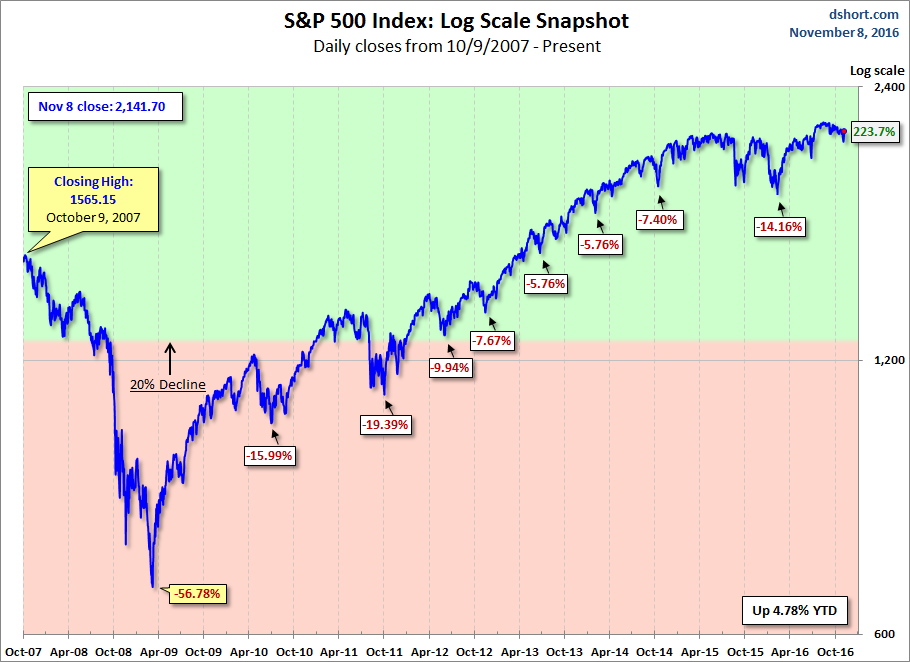
Here is a more conventional log-scale chart with drawdowns highlighted.
(Click on image to enlarge)
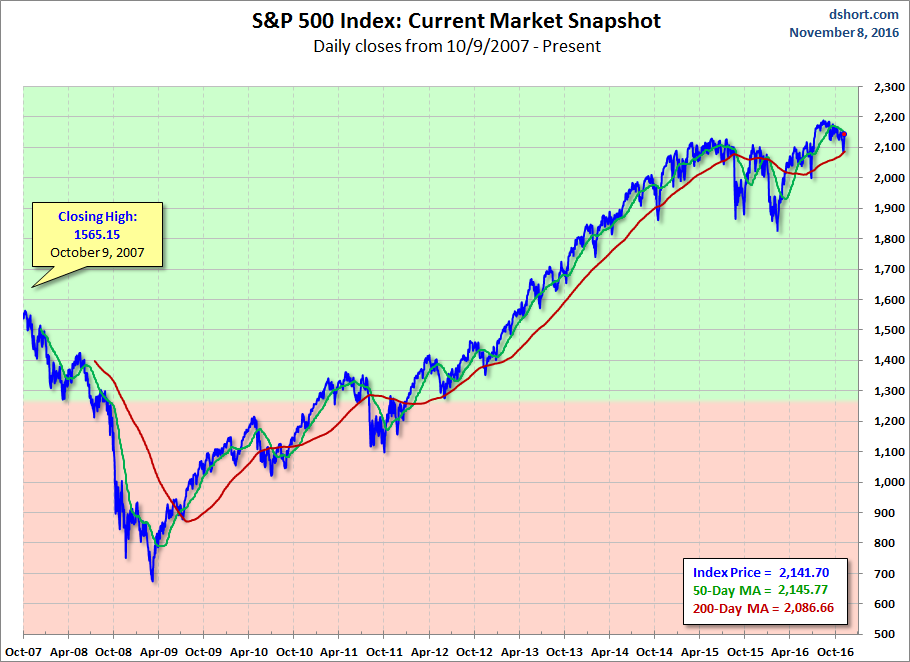
Here is a linear scale version of the same chart with the 50- and 200-day moving averages.
(Click on image to enlarge)
A Perspective on Volatility
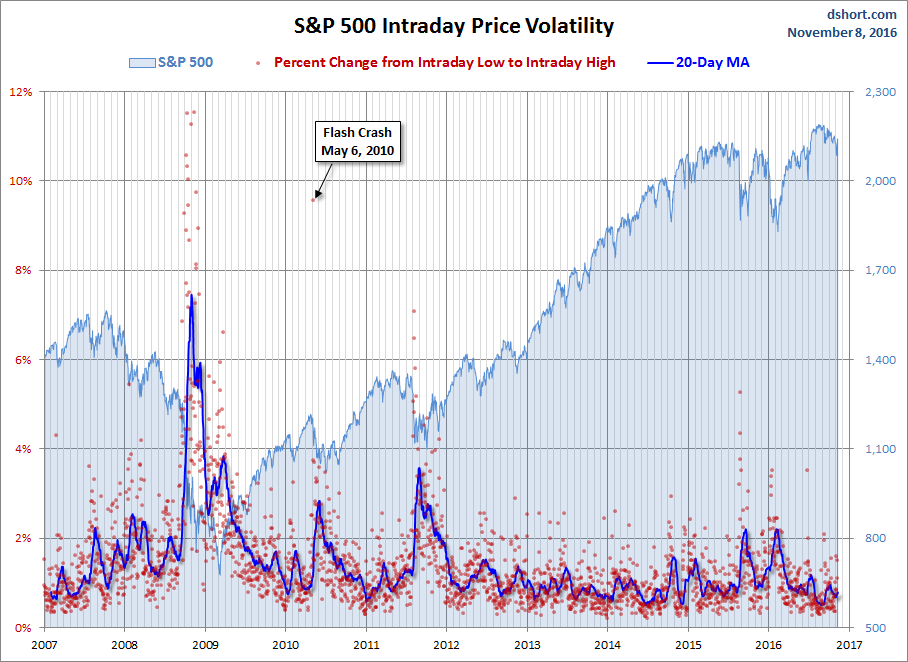
For a sense of the correlation between the closing price and intraday volatility, the chart below overlays the S&P 500 since 2007 with the intraday price range. We've also included a 20-day moving average to help identify trends in volatility.
(Click on image to enlarge)


Comments
Log in or sign up to join the conversation.