

The S&P 500 ended the session with a modest gain, but the session itself was quite dramatic. The index plunged at the open and sold off to its -1.02% intraday low a bit over an hour later. It then trudged upward to its 0.39% intraday high about 12 minutes before the trimmed closing gain of 0.31%. Today's big reversal, a 1.43% intraday range, snapped the five-day selloff. The question now is whether we've seen a post-FOMC interim low for US equities. Possibly, but the recovery in equities wasn't confirmed by the Treasury bond market.
The 10-year note closed at 1.57%, down three BPs from the previous session. The 20-year bond yield at dropped three BPs to 1.96%, a new post-recession low, and the 30-year bond dropped four BPs to 2.39%, which is only 14 BPs above its post-recession low. 10-2 year yield spread at 0.87% is a post-recession low.
Here is a snapshot of past five sessions in the S&P 500.

Here is a daily chart of the index. Trading volume was unremarkable. The index closed in the vicinity of its 50-day price moving average.

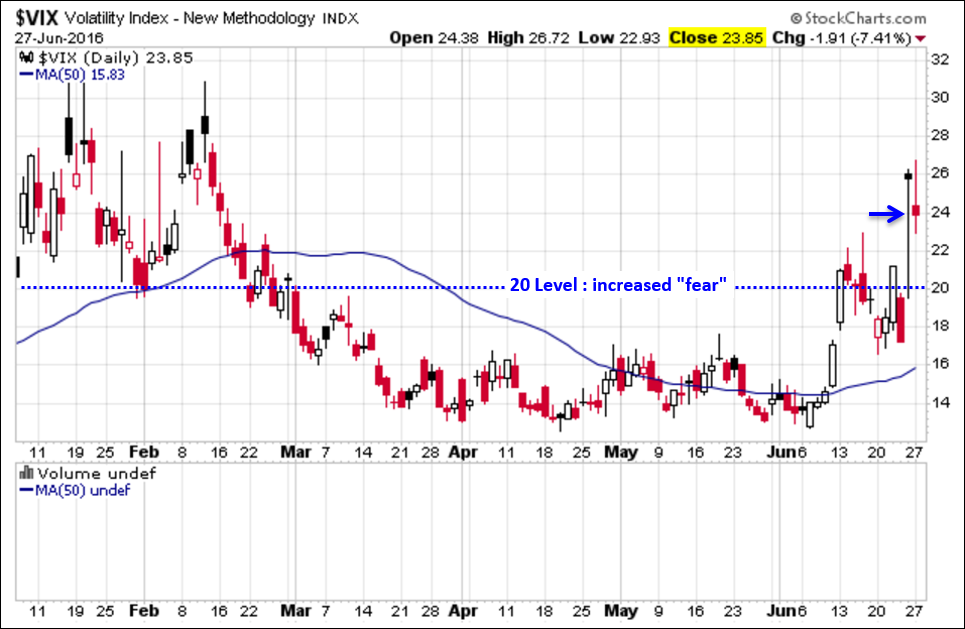
Here's a look at the VIX volatility index, the celebrated "fear gauge" market indicator. The early morning selloff pushed the VIX to an interim high, but it closed the session below the proverbial 20 "fear" benchmark.
A Perspective on Drawdowns
Here's a snapshot of selloffs since the 2009 trough.
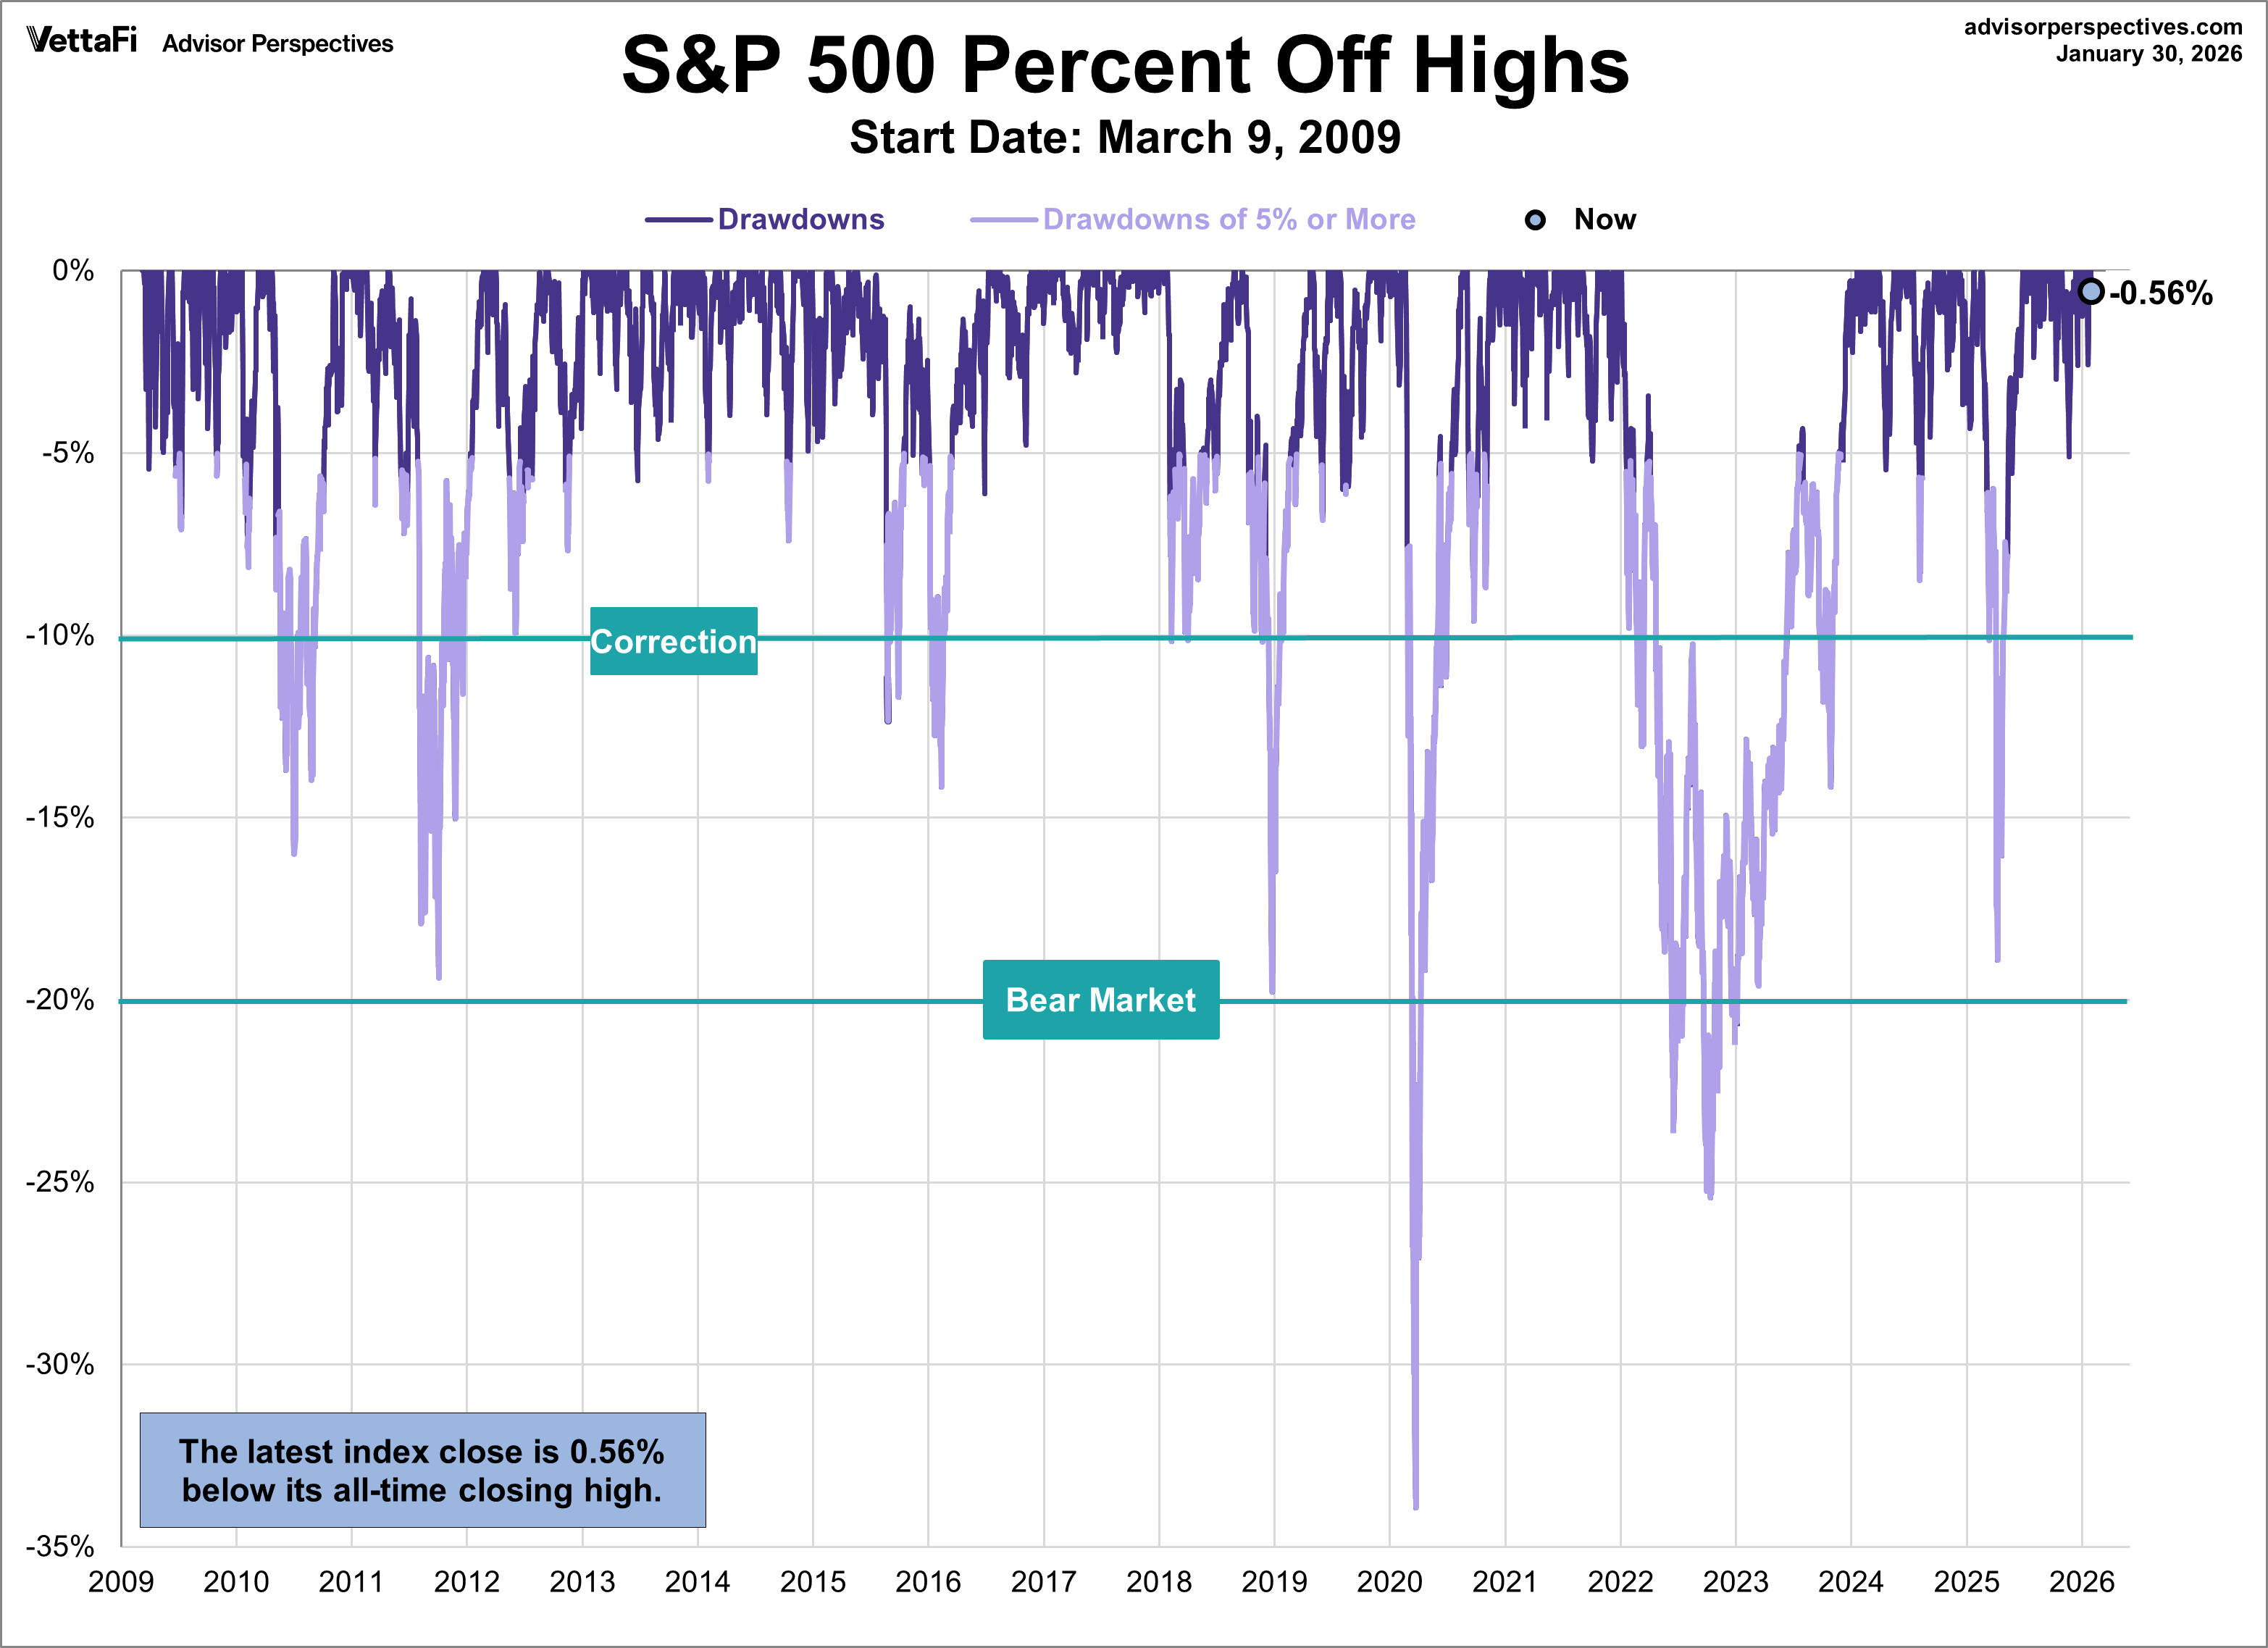
Here is a more conventional log-scale chart with drawdowns highlighted.
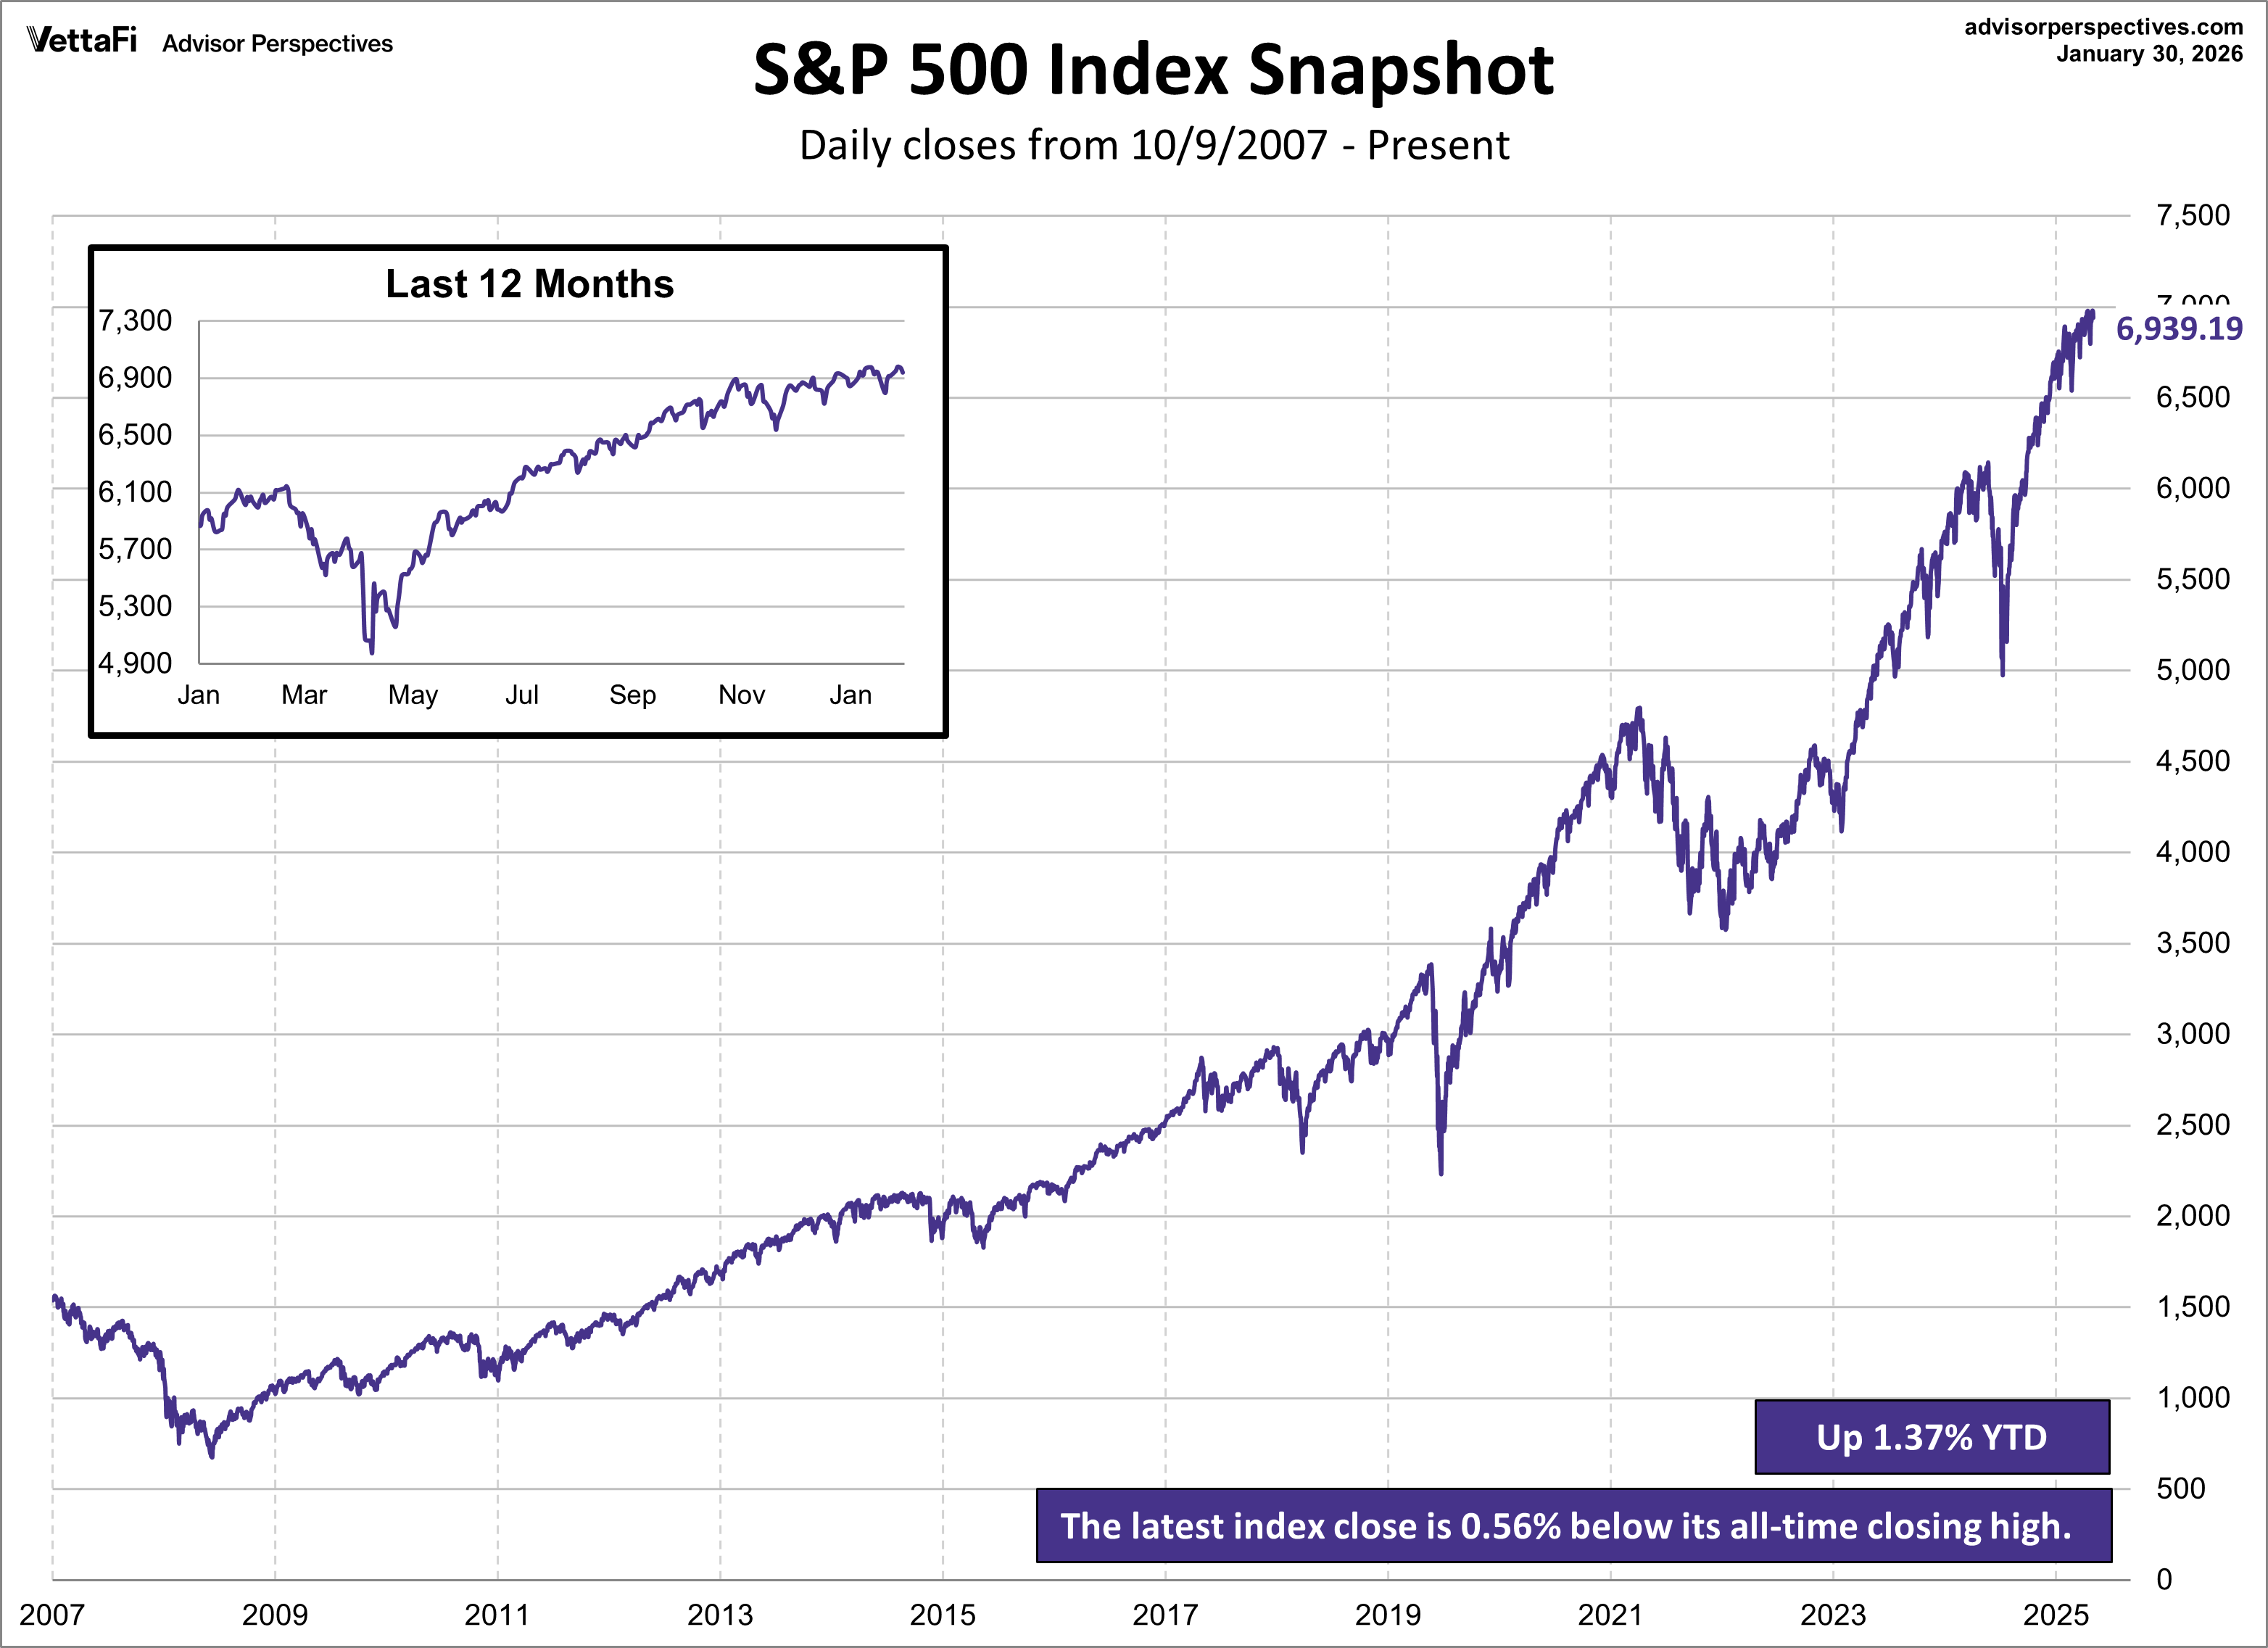
Here is a linear scale version of the same chart with the 50- and 200-day moving averages.

A Perspective on Volatility
For a sense of the correlation between the closing price and intraday volatility, the chart below overlays the S&P 500 since 2007 with the intraday price range. We've also included a 20-day moving average to help identify trends in volatility.




Comments
Log in or sign up to join the conversation.