

The massive selloff in global markets continued today. The Shanghai Composite fell 1.04%, the Nikkei plunged 3.71% and the Euro STOXX 50 took a 3.28% dive. Our benchmark S&P 500 opened in the red at its intraday high and sold off aggressively to its noon hour -3.37% low. A major afternoon took the index to within a hair's breadth of its intraday high until selling in the final 30 minutes reduced the recovery to a -1.17% closing loss.
The yield on the 10-year note closed at 2.01%, down 5 basis points from the previous close, which was well off its 1.94% intraday low.
Here is a snapshot of past five sessions.

Here is a daily chart of the index. Volume surged on today volatility. Was today's selloff a capitulation with the worst now behind us? That will depend in large measure on the direction of global markets, the tone of earnings reports and the direction of crude oil, which hit new interim lows today, with February future falling below $27.

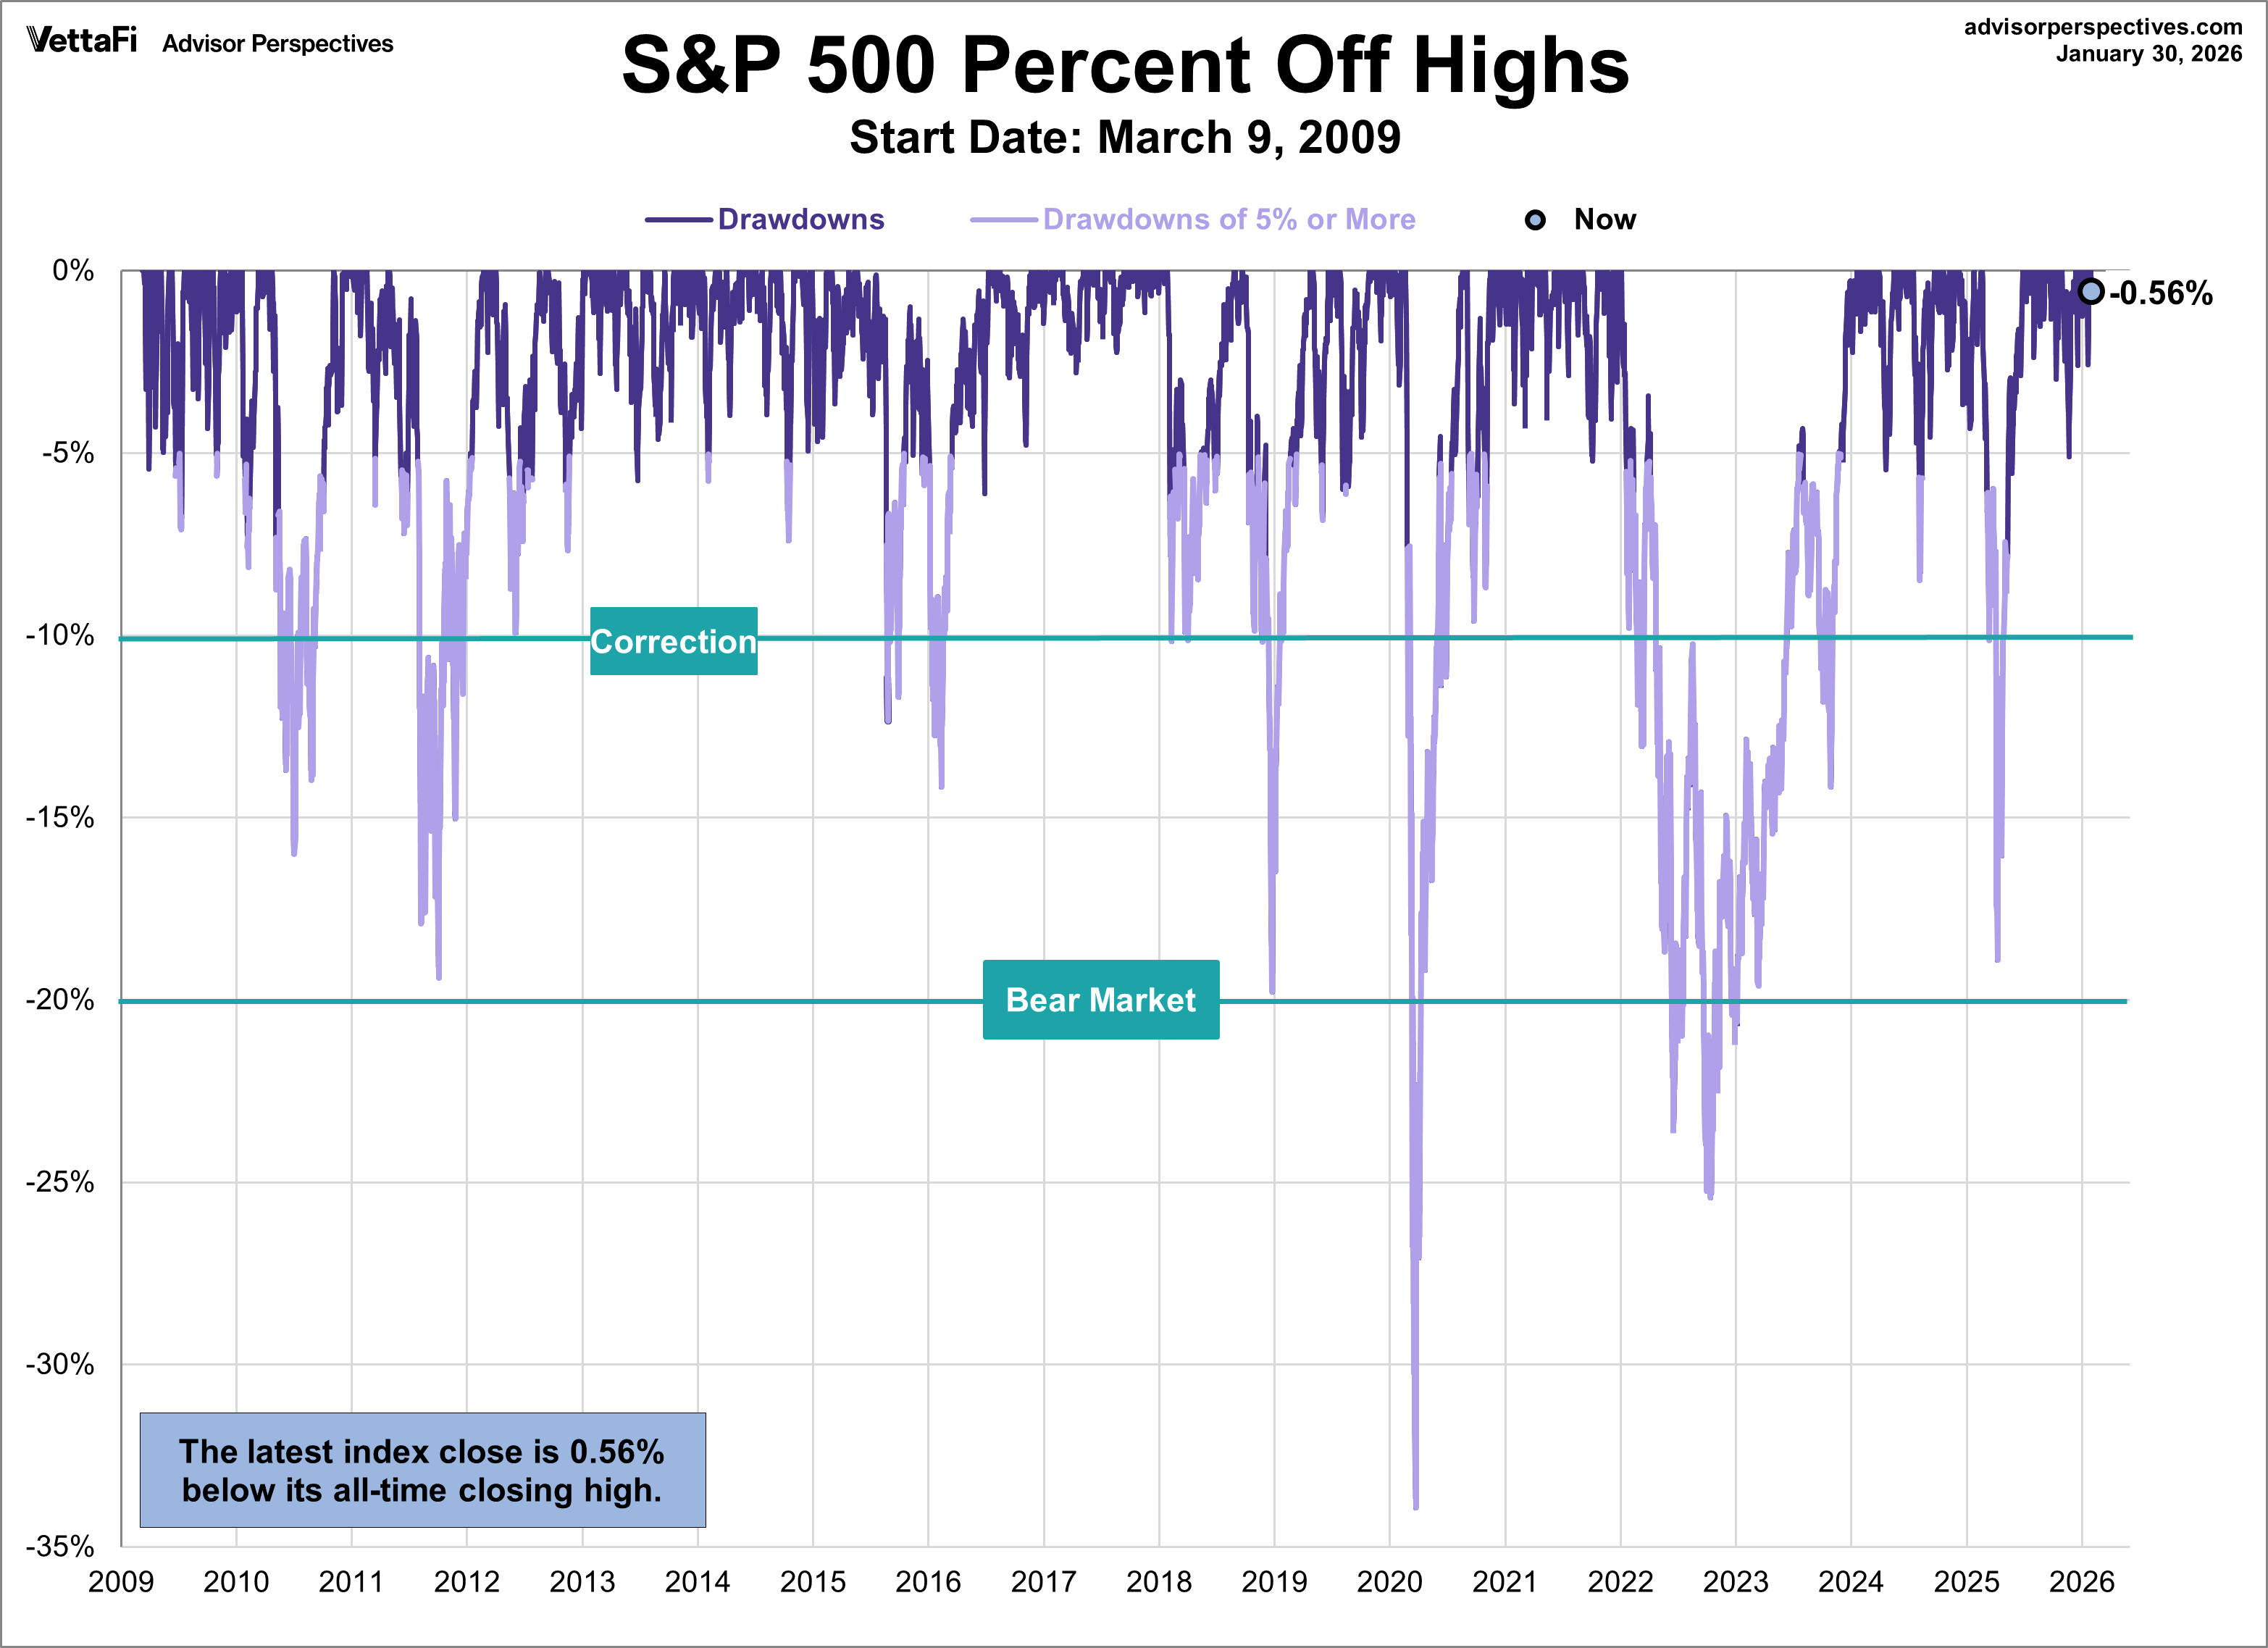
A Perspective on Drawdowns
Here's a snapshot of selloffs since the 2009 trough.
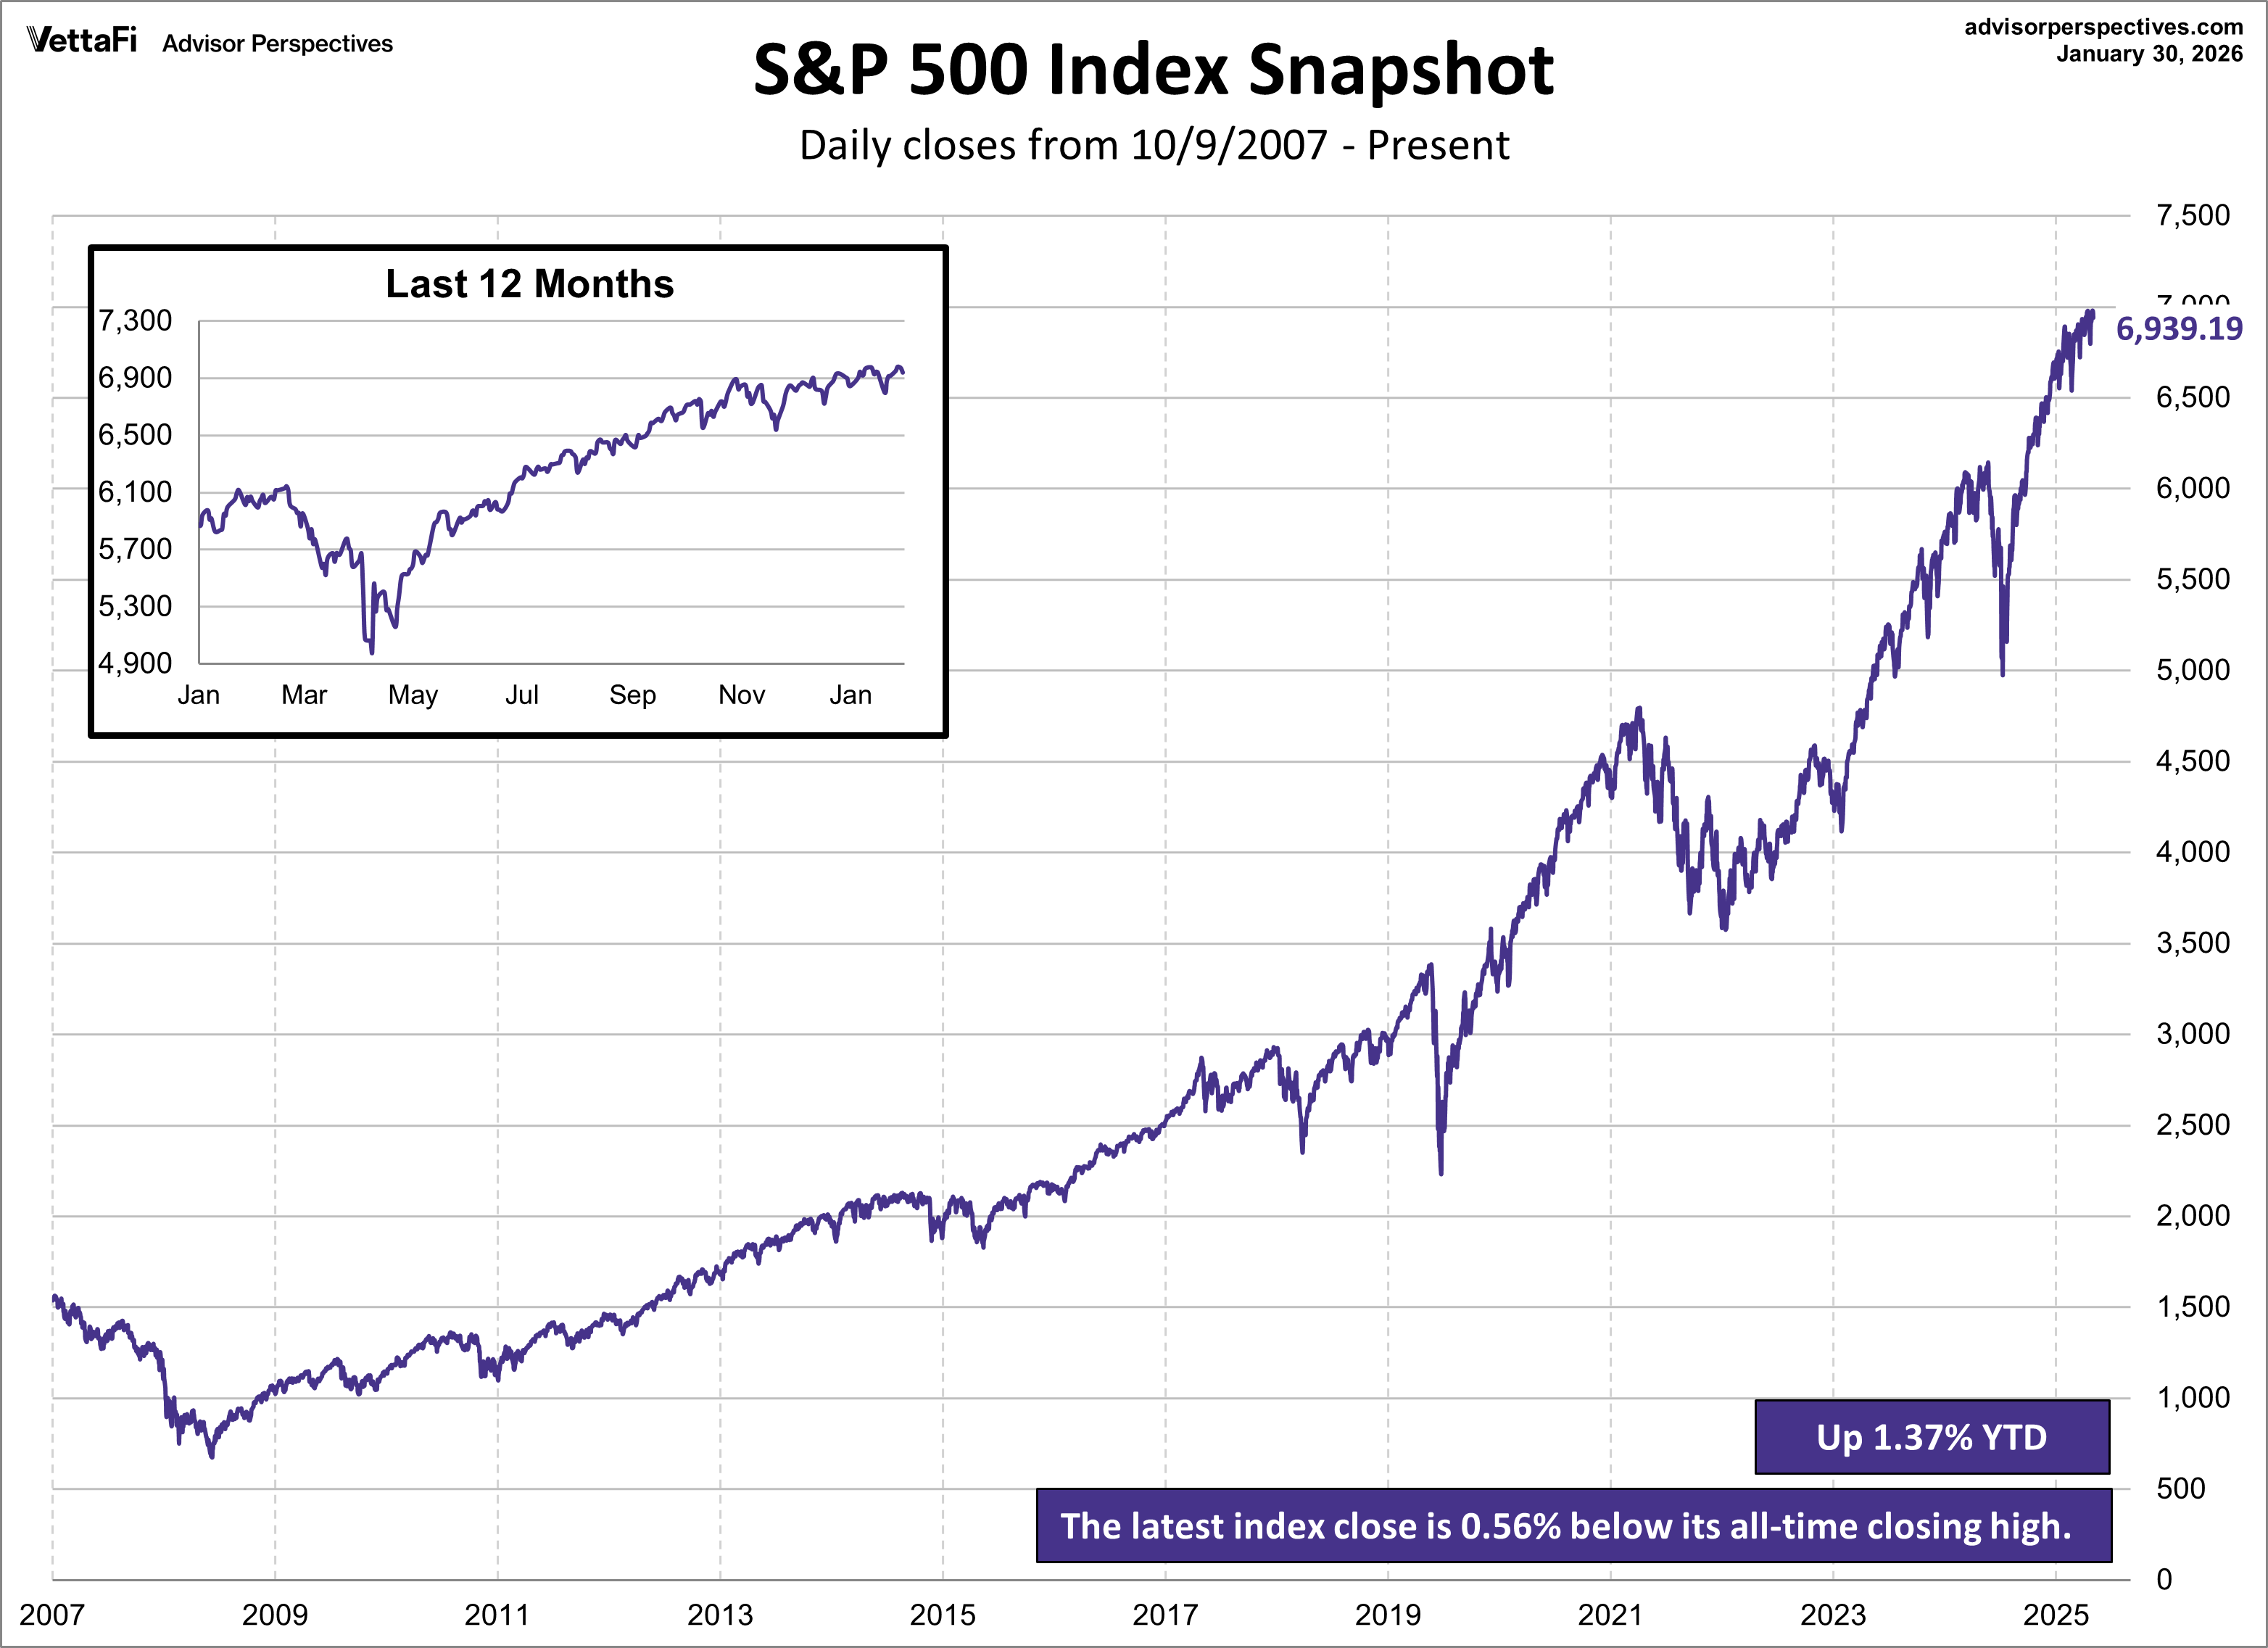
For a longer-term perspective, here is a log-scale chart base on daily closes since the all-time high prior to the Great Recession.
Here is the same chart with the 50- and 200-day moving averages.




Comments
Log in or sign up to join the conversation.