

The global rally in major equity markets around the globe lost some steam today. Asian indexes were the best of the lot with the Nikkei up 0.84% and the Shanghai up 0.36%. But European indexes were mixed with a downward skew. The DAX closed at -0.33%, the FTSE -0.15% and the CAC was up a fractional 0.9%. The big three in the US were also mixed: the Dow up 0.13% and the Nasdaq down 0.34%. Our benchmark S&P 500 traded in a narrow range and closed with a microscopic 0.01% gain. But any finish in the green earned the distinction of the third consecutive record close of its four-day rally. The yield on the 10-year note fell five basis points to close at 1.48%.
Here is a snapshot of past five sessions in the S&P 500.

Here is a daily chart of the S&P 500. The preliminary read on rading volume was 15% below its 50-day moving average.

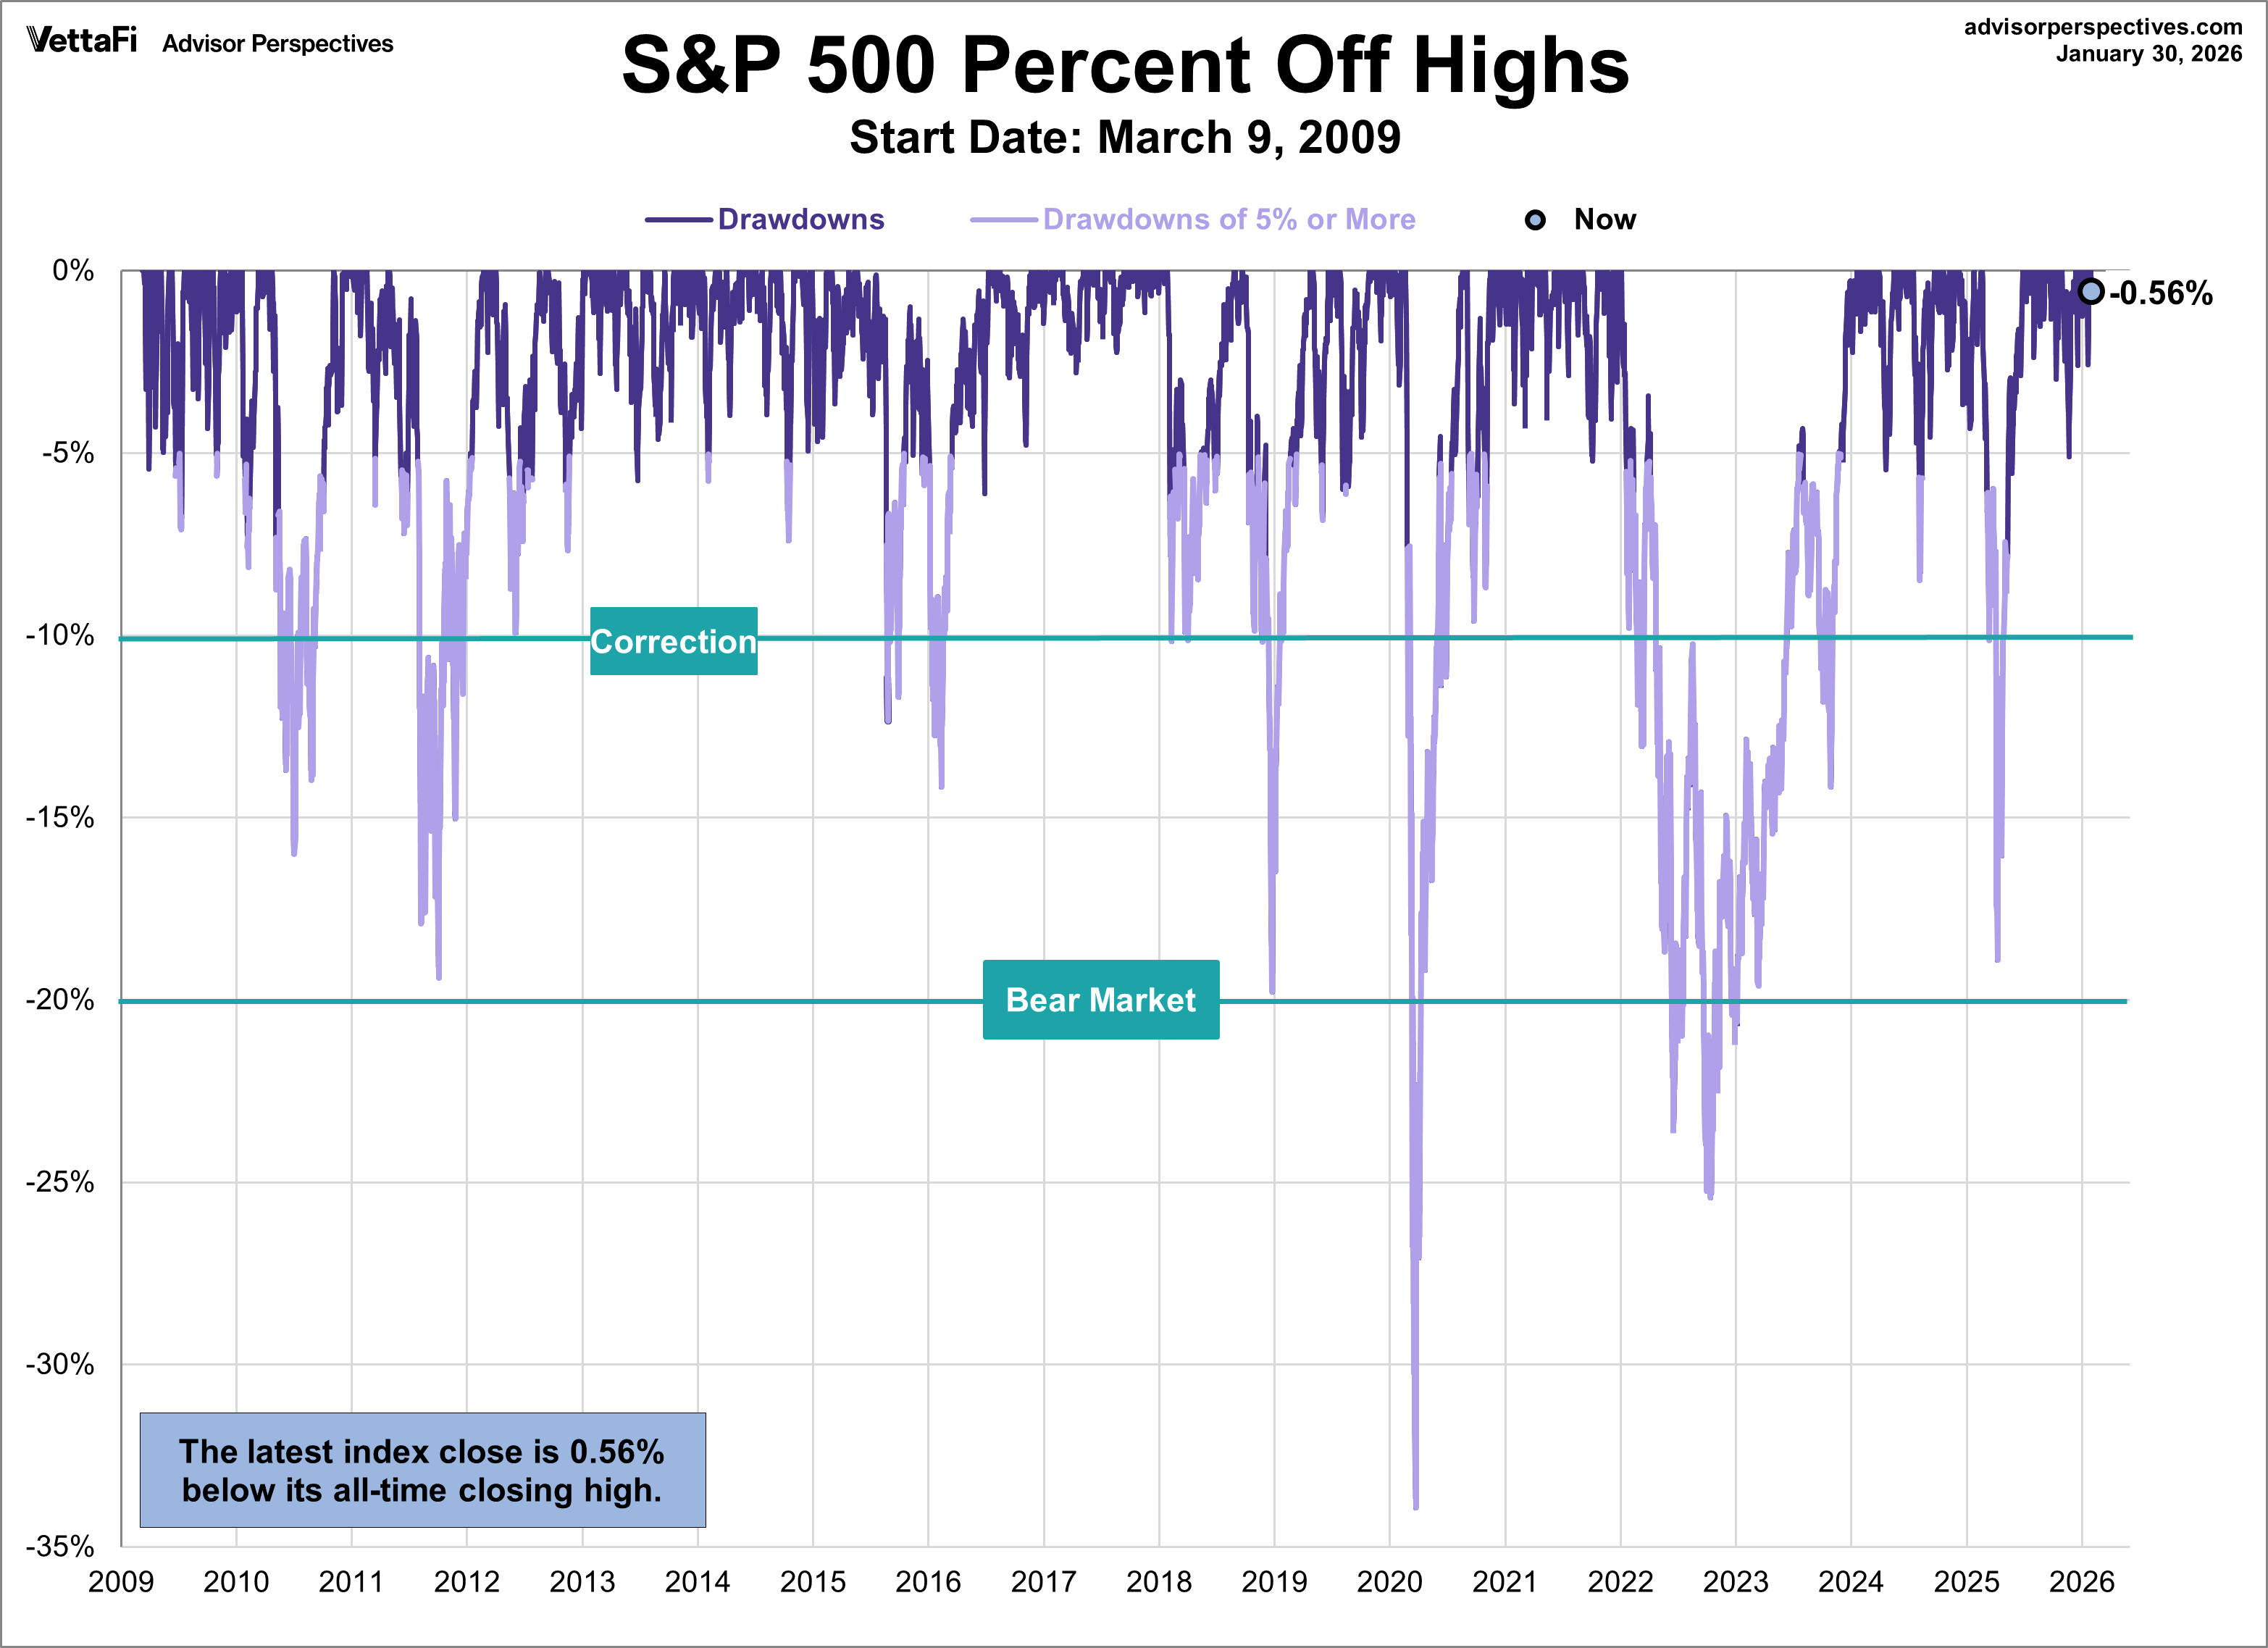
A Perspective on Drawdowns
Here's a snapshot of selloffs since the 2009 trough.
Here is a more conventional log-scale chart with drawdowns highlighted.
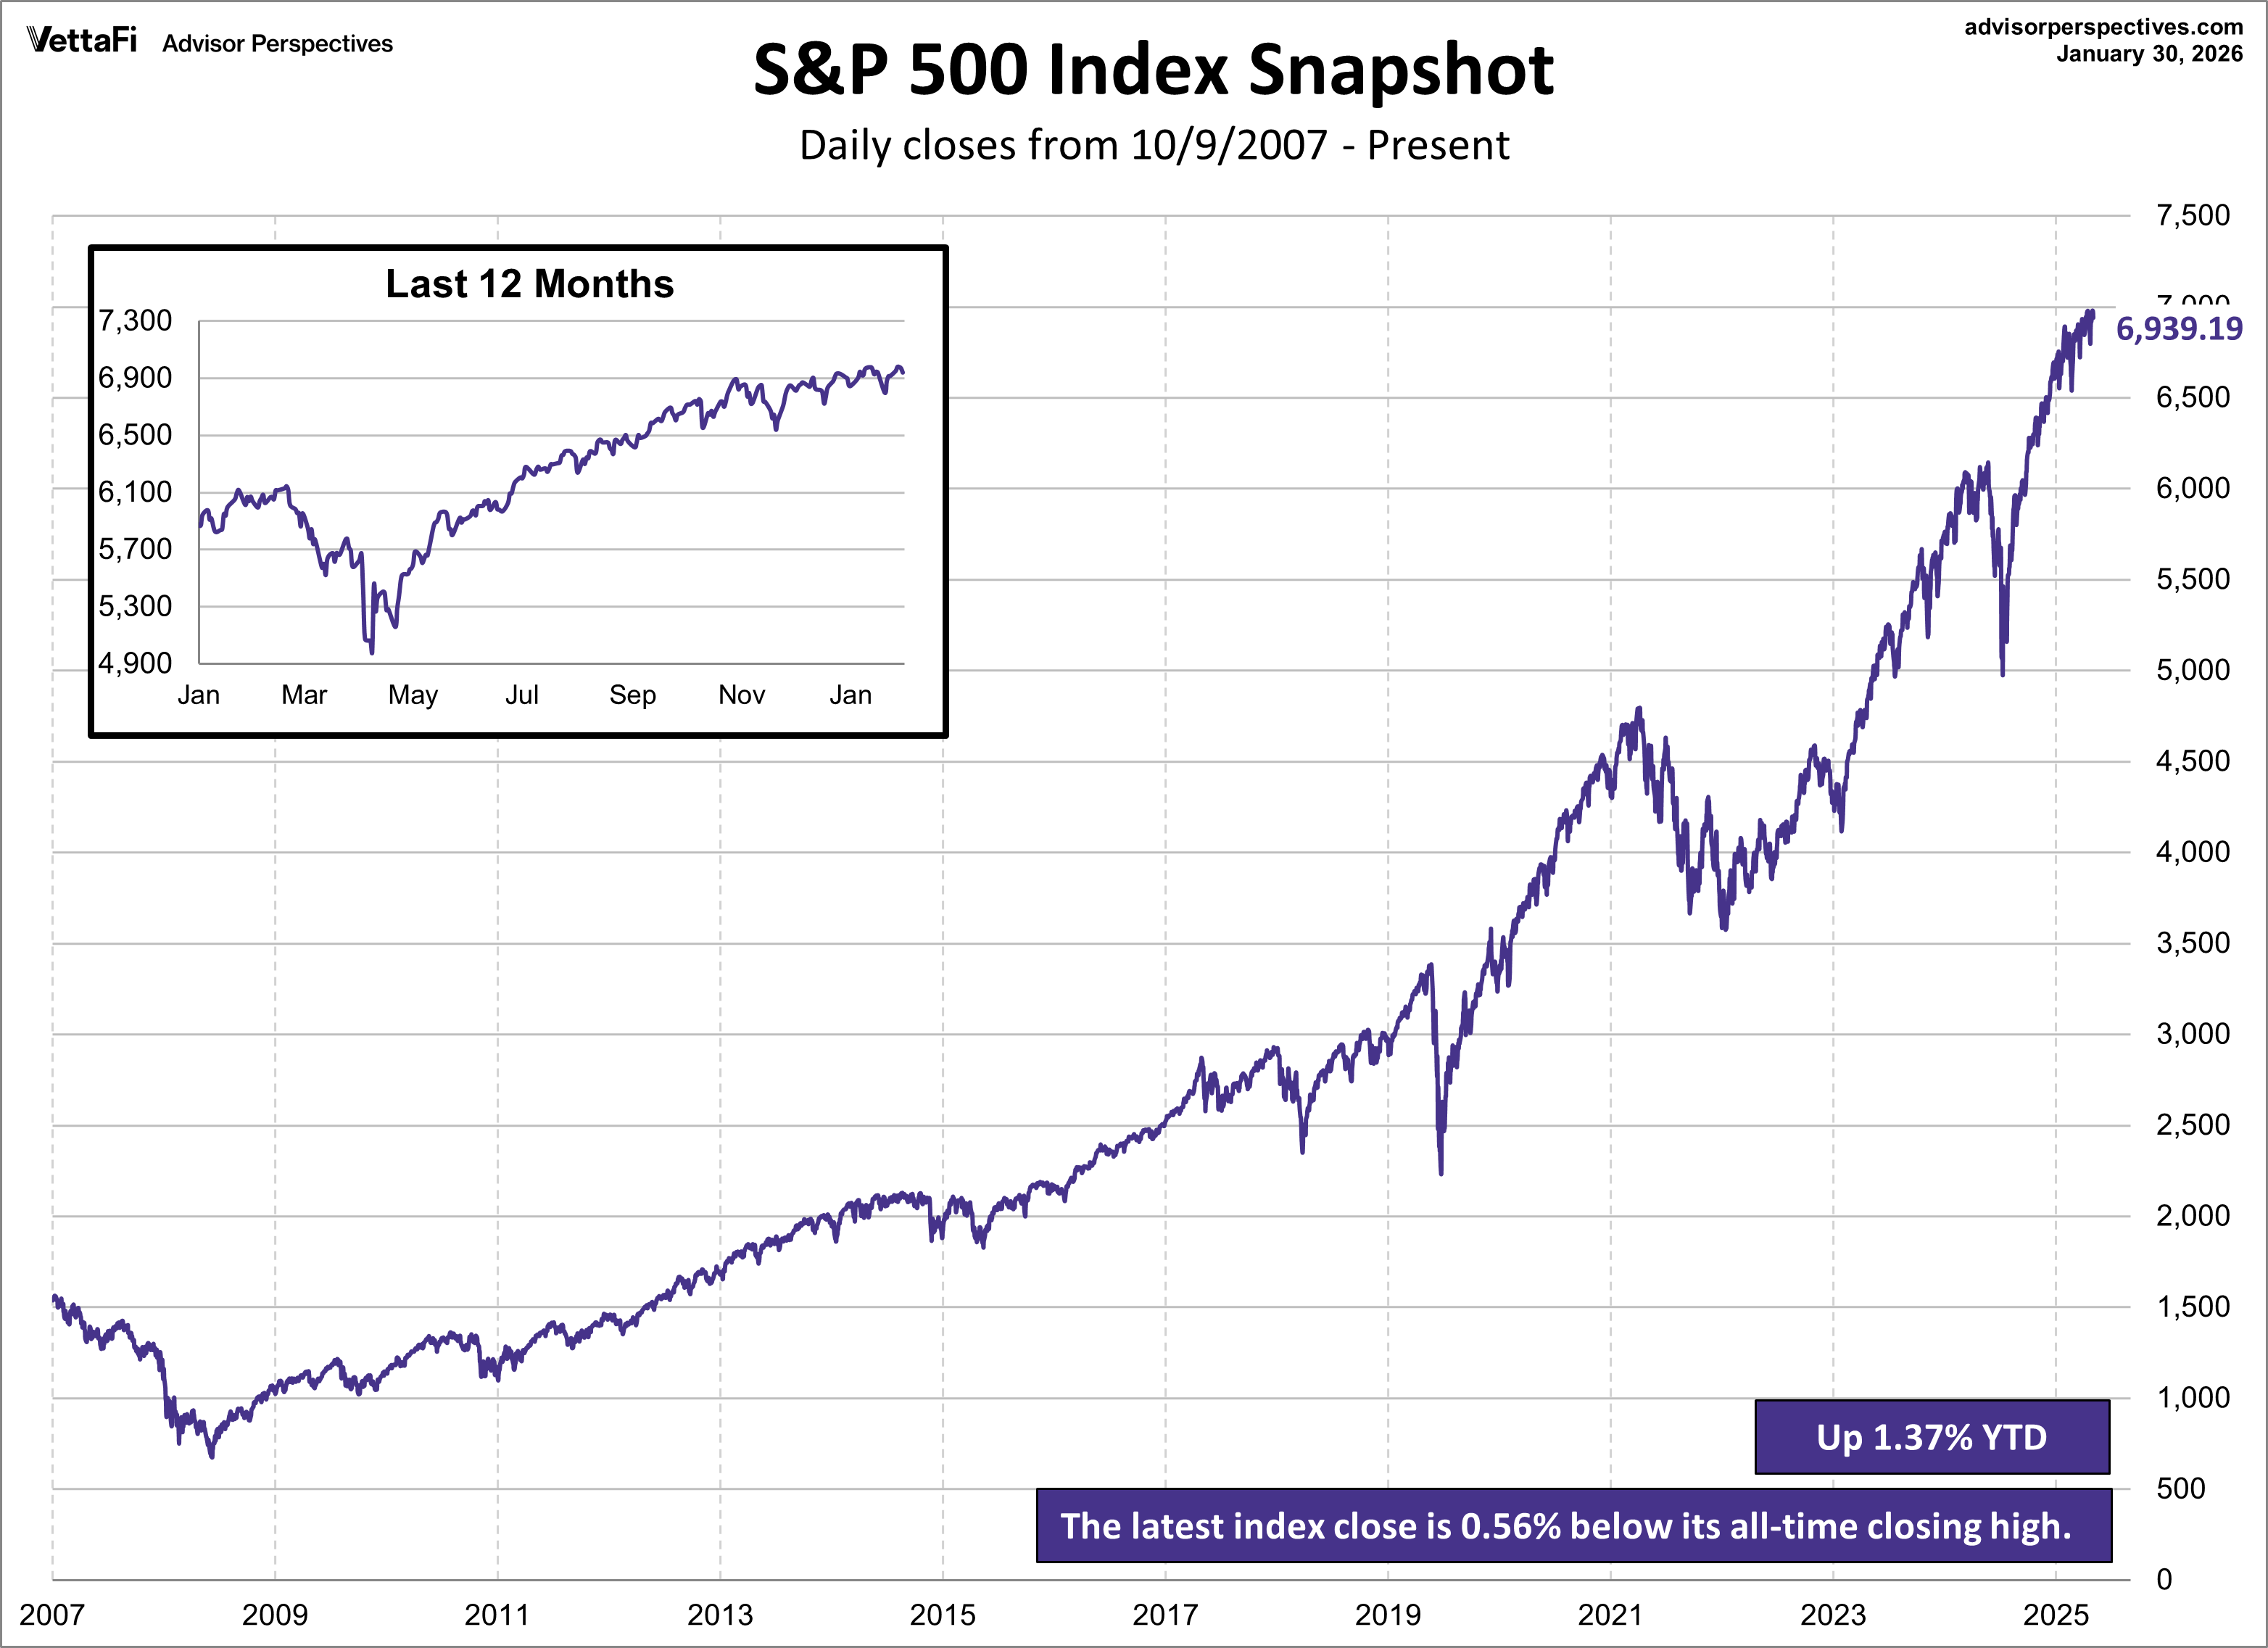
Here is a linear scale version of the same chart with the 50- and 200-day moving averages.

A Perspective on Volatility
For a sense of the correlation between the closing price and intraday volatility, the chart below overlays the S&P 500 since 2007 with the intraday price range. We've also included a 20-day moving average to help identify trends in volatility.




Comments
Log in or sign up to join the conversation.