

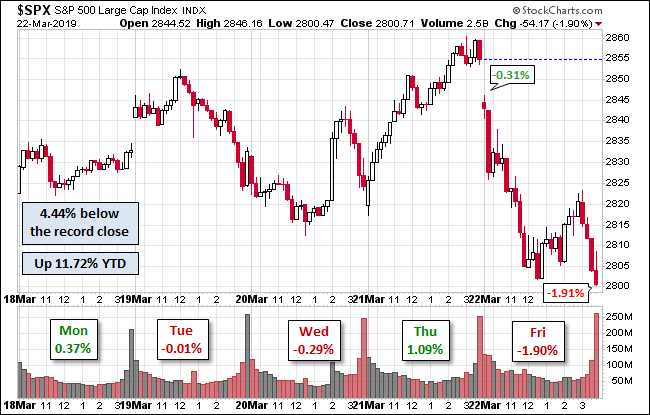
The S&P 500 rose for most of the week until some political news and treasury yield curve information came to light on Friday. The index closed 1.9% down from Thursday and down 0.77% from last Friday. The index is still up 11.7% YTD.
The U.S. Treasury puts the closing yield on the 10-year note at 2.44%.
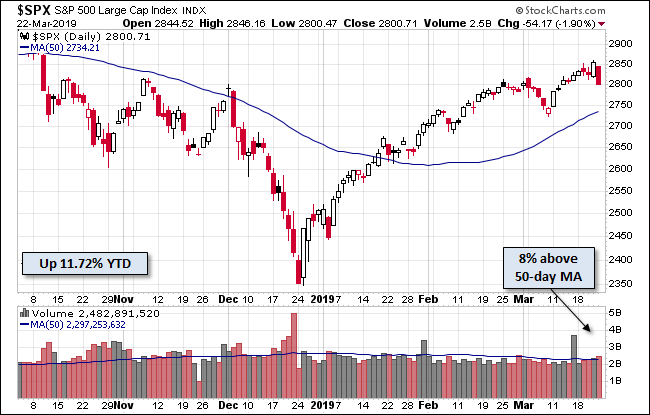
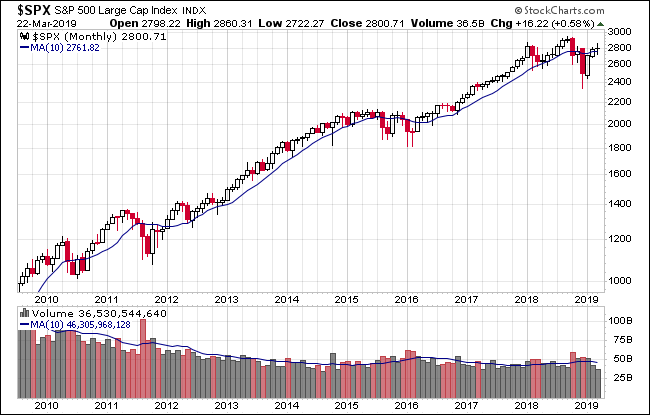
Here's a snapshot of the index going back to December 2008.
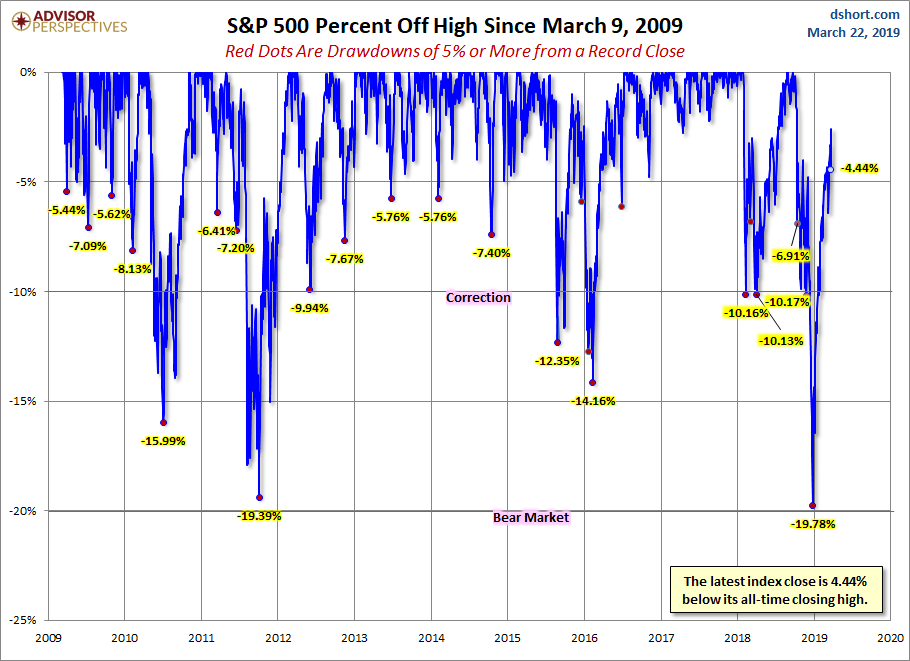
A Perspective on Drawdowns
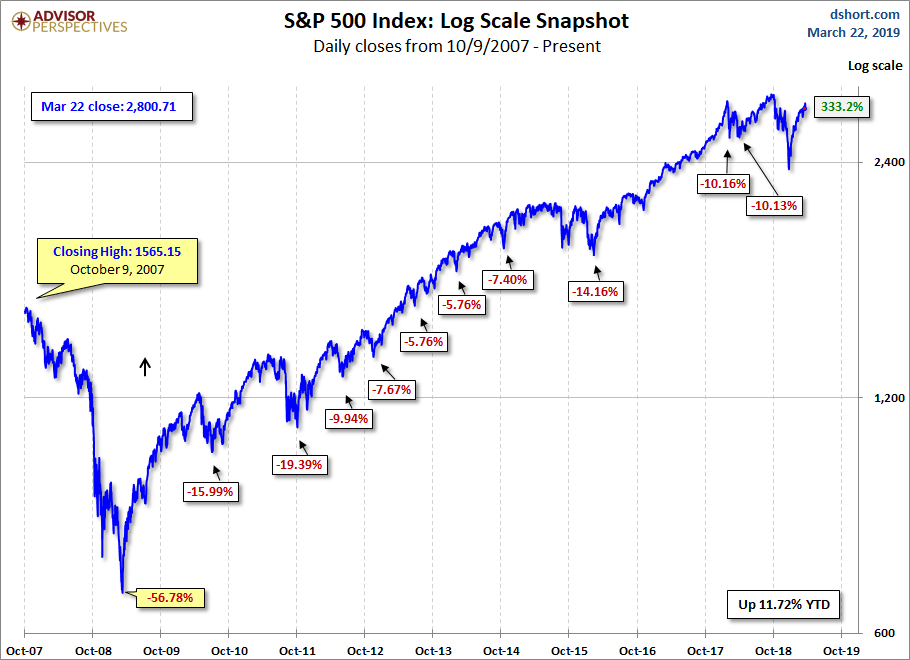
Here's a snapshot of record highs and selloffs since the 2009 trough.
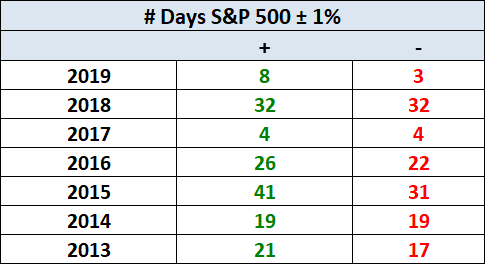
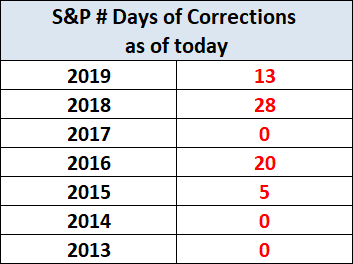
Here's a table with the number of days of a 1% or more change in either direction and the number of days of corrections (down 10% or more from the record high) going back to 2013.
Here is a more conventional log-scale chart with drawdowns highlighted.
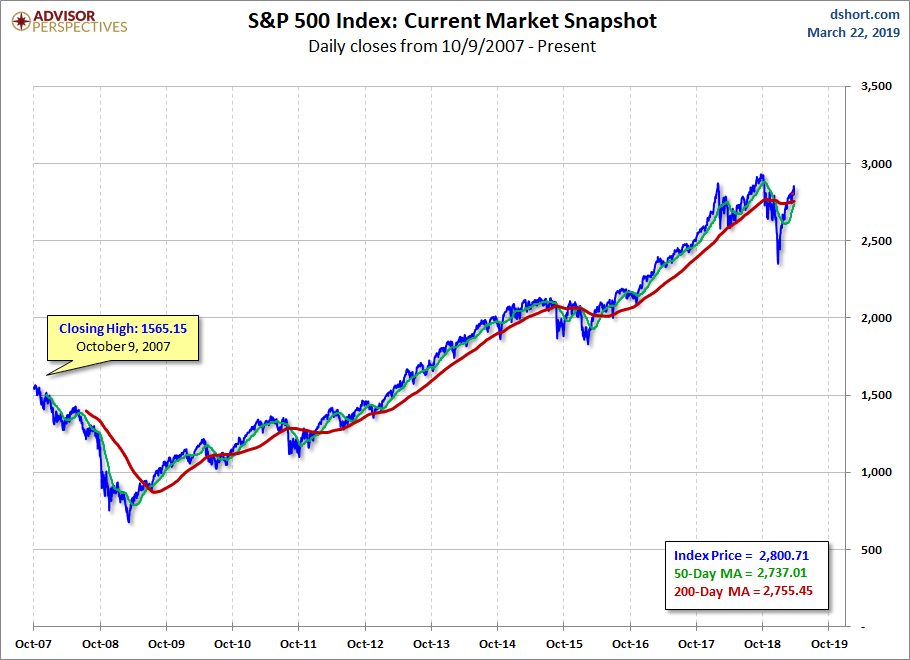
Here is a linear scale version of the same chart with the 50- and 200-day moving averages.
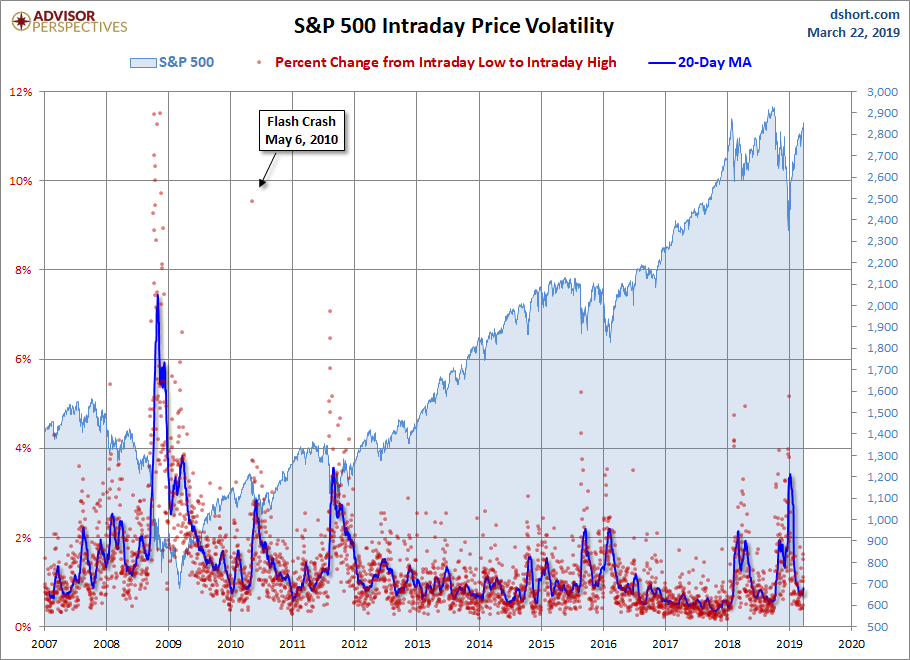
A Perspective on Volatility
For a sense of the correlation between the closing price and intraday volatility, the chart below overlays the S&P 500 since 2007 with the intraday price range. We've also included a 20-day moving average to help identify trends in volatility.



Comments
Log in or sign up to join the conversation.