
(Click on image to enlarge)
There have been a lot of red investing screens in 2022 as the stock market correction/bear market has only intensified as the days wear on.
Sometimes zooming out to a longer-term picture of the market helps offer perspective. But that doesn’t necessarily mean it makes today’s picture any less bearish!
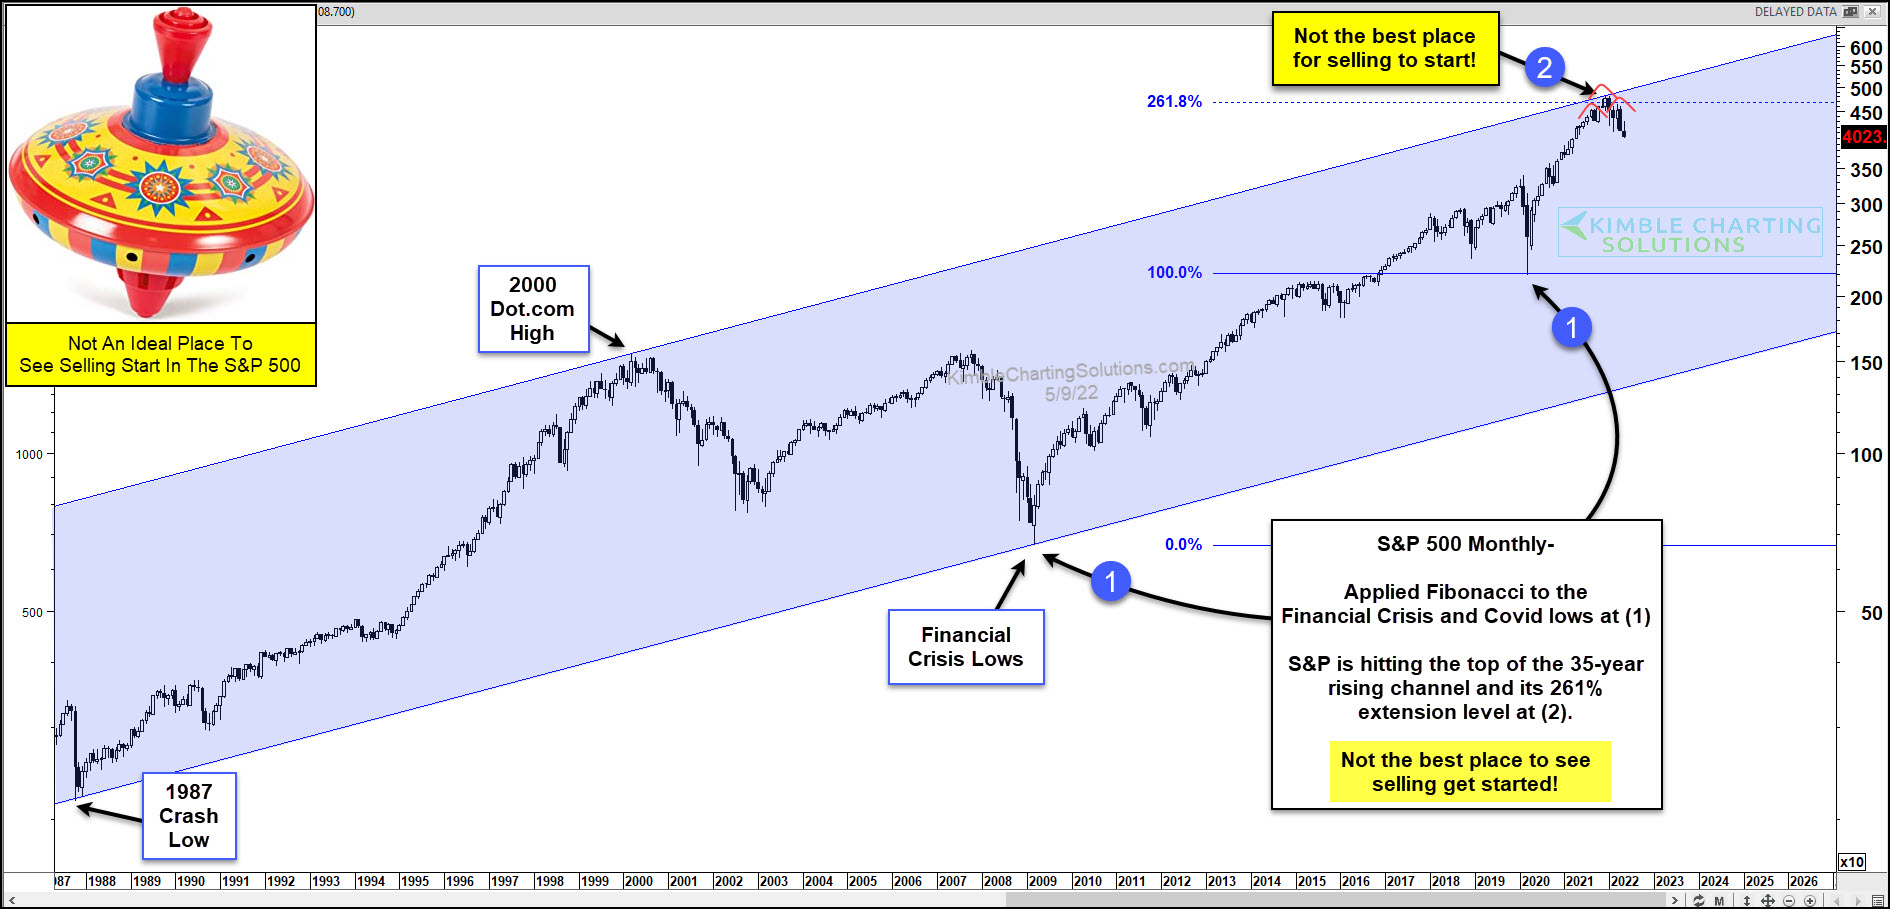
Today’s chart takes a long-term “monthly” look at the S&P 500. For this particular analysis, we take the lows from 2009 and 2020 marked by each (1) and use applied Fibonacci. This produces a 261.8 Fibonacci extension level that just so happens to rest near the 2022 highs.
This is not the best place for selling to start!
And there’s more… this also marks the upper end of a multi-decade rising price channel that marked the 2000 dot com high… and the 1987 crash low and financial crisis low. There’s also a lot of room below if the selling continues.
Can bulls recover and push prices upward toward the top side of the channel? Or will bears remain in control and push prices lower. Stay tuned!


Comments
Log in or sign up to join the conversation.