

The S&P 500 (Index: SPX) rode its rally above its mean trendline with respect to its trailing year dividends per share for the first few weeks of October 2026. But the index kept dipping below it starting in the last week of the month before breaking more sharply below it on the last day of the month.
The culprit behind the downward move was the drop in several megacap AI tech stocks, which thanks to their outsized concentration within the market capitalization-weighted index, caused it to drop below it when they turned south after reporting disappointing revenues and a diminished earnings outlook.
By contrast, the stocks of S&P 500 companies outside of the megacap AI tech stocks did pretty well during the month, but they didn't gain enough market cap to offset the losses of the most heavily weighted companies in the index.
The following chart visualizes the relationship between the value of the S&P 500 and its underlying trailing year dividends per share from 29 December 2023 through 30 October 2026:
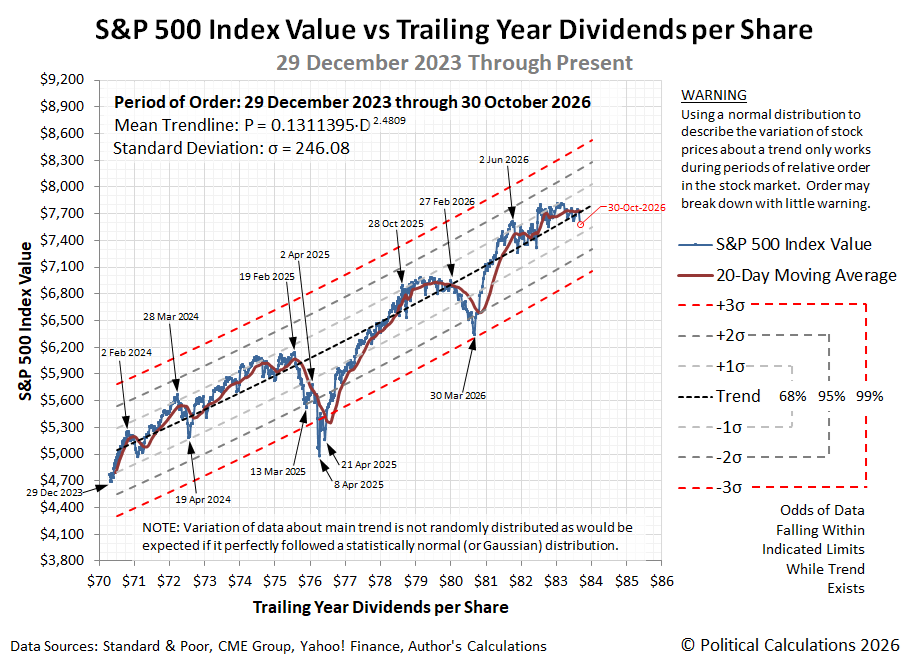
Overall, stock prices behaved in an orderly manner in October 2026, with the index' trajectory keeping within one standard deviation of its mean trendline throughout the month.

Comments
Log in or sign up to join the conversation.