

(Click on image to enlarge)
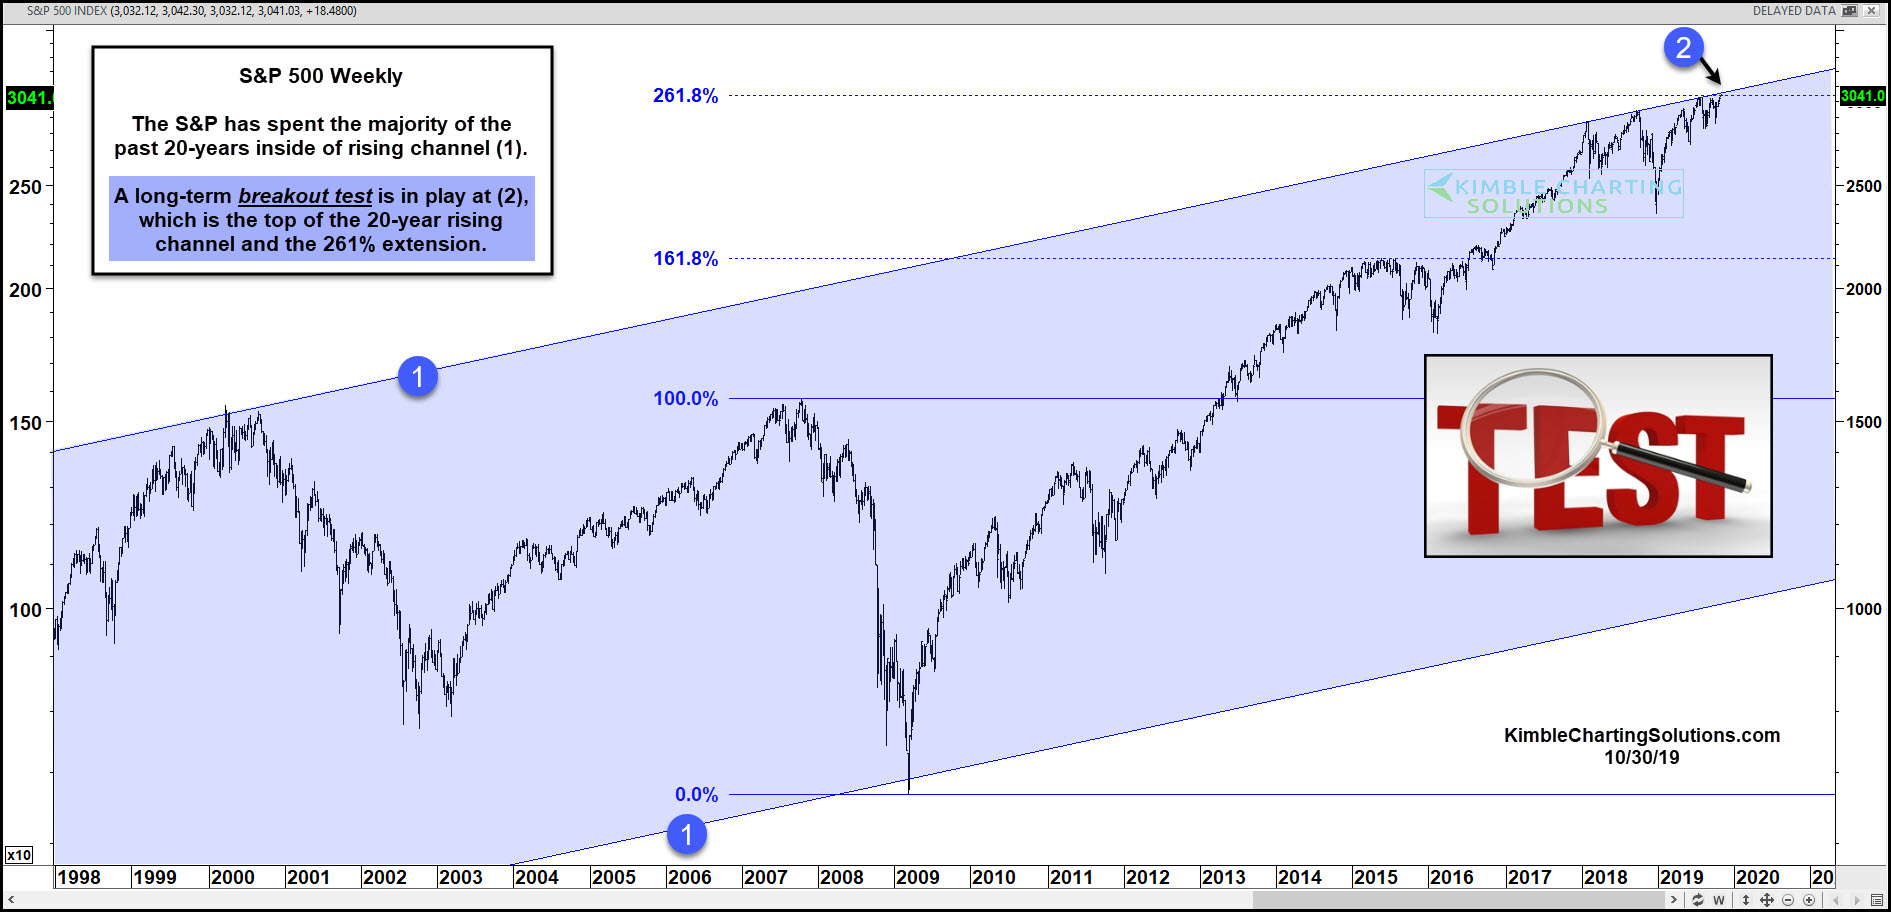
The S&P 500 Index appears to be setting up for an important breakout “TEST”.
Stock market bulls are cheering for a breakout, while bears are looking for a pullback off resistance.
In today’s chart, we look at the S&P 500 Index on a longer-term “weekly” basis.
As you can see, the S&P 500 has spent the majority of the past 20 years trading within a broad, rising price channel at each (1).
It is currently testing the top of this 20-year channel at (2). This area also happens to be the 261% Fibonacci price extension level of the 2007 highs and 2009 lows.
With the trend being up, this becomes a very important breakout test for the S&P 500!
Will the S&P 500 breakout? Or will bears turn prices lower? This is an important juncture for investors.



Comments
Log in or sign up to join the conversation.