

In my last post on the S&P 500 Index (SPX), I mentioned 2750 as major resistance and 2680 as near-term support.
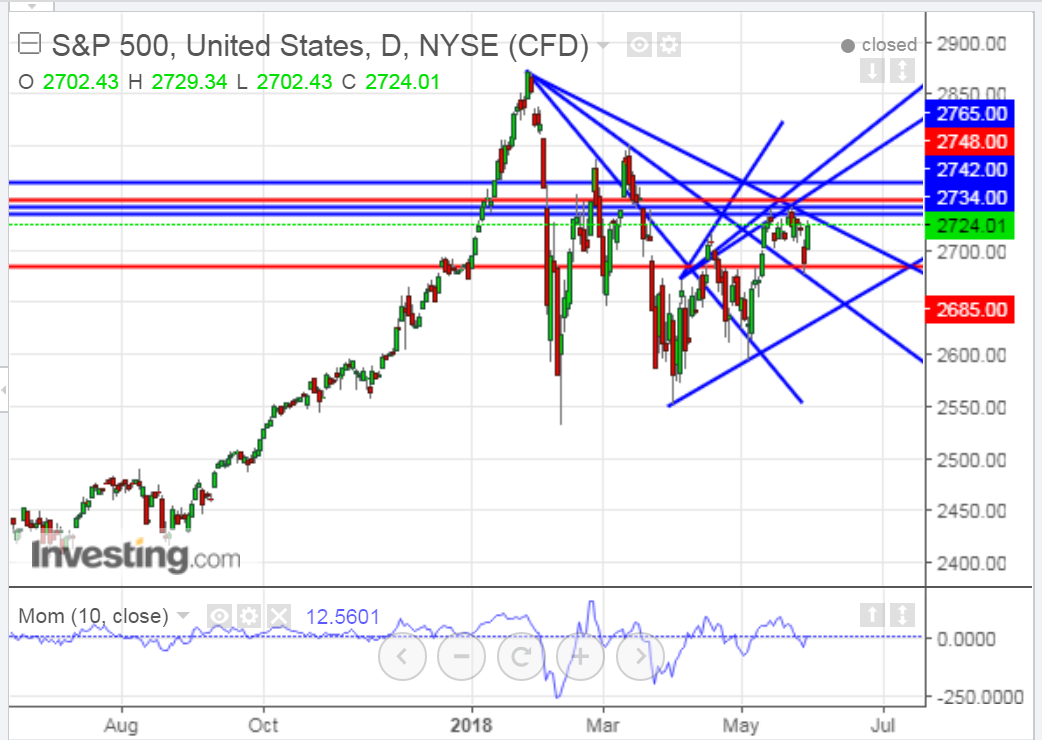
Since then, price has bounced around in between those levels, as shown on the daily chart below. At the moment, those two levels are confirmed by a variety of intersecting trendlines...most notably the two red horizontal lines (2748 and 2685), which are the nearest to these two levels.
Until we see a clean break and hold either above or below this red consolidation zone, the SPX will continue its sometimes extreme, volatile whipsaw action in a trendless manner.
It's unclear whether momentum favors a breakout to the upside, inasmuch as the last swing high on the momentum indicator was lower than its previous swing high, in a divergence with the last two swing highs made by the price. However, this may have been intentional and meant to be used as a possible "bear trap" in preparation for the resumption of the rally that began in early April.
Perhaps the month of June will produce either a decisive continuation and confirmation of this 2-month uptrend, or a reversal, which may become clearer after this Friday's employment data is released. Keep a close eye on the momentum indicator to support a "red zone" breakout in either direction.
Inasmuch as the July 4th Independence Day holiday is only a month away, I'd make a wild guess that market players will favor a breakout to the upside, possibly producing a new record high by then before taking some profits to enjoy for the summer holidays...so, we'll see.
(Click on image to enlarge)



Comments
Log in or sign up to join the conversation.