
Although the S&P 500 Index appears oversold and due for a bounce, technical indicators suggest it could then continue lower. A chart with the details follows our regular Market Review.
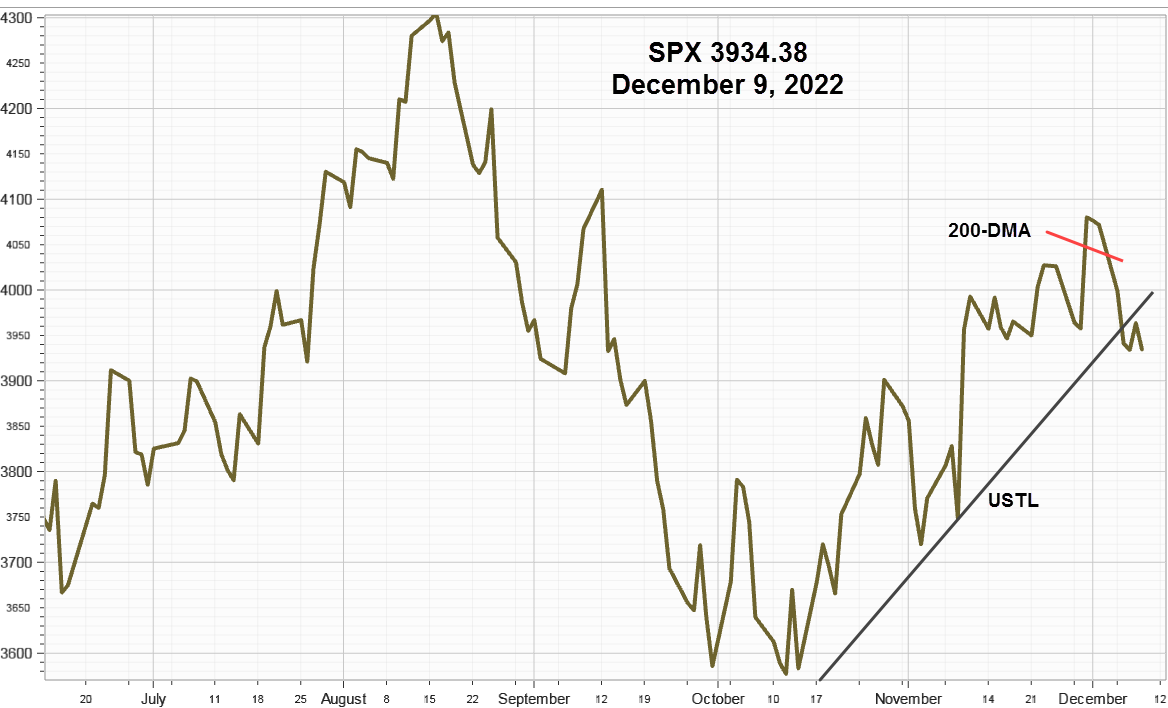
S&P 500 Index (SPX) 2752.06 continued lower declining 74 points or -2.62% last week, closing below the important 200-day Moving Average on news that Mexico may also be subject to import tariffs while harsh rhetoric from China suggests a trade agreement has become less likely anytime soon. Previous support around 2800 finally gave way to increasingly bearish fundamentals including a strong US Dollar, and rapidly declining interest rates along with crude oil prices. See the chart below.
CBOE Volatility Index® (VIX) 18.71 popped up 2.86 points or +18.04% last week. Our similar IVolatility Implied Volatility Index Mean, IVXM using four at-the-money options for each expiration period along with our proprietary technique that includes the delta and vega of each option, added 3.50 points or +24.67 % ending at 17.69. Here are the IVXM and SPX charts.


VIX Futures Premium
The chart below shows as our calculation of Larry McMillan’s day-weighted average between the first and second-month futures contracts.
With 12 trading days until June expiration, the day-weighted premium between June and July allocated 60% to June and 40% to July resulting in a negative premium of -2.30% vs. 7.21% for the week ending May 24, below caution zone between zero and 10 and into the red danger zone. As a leading indicator, it has been cautious for the last four weeks.

The premium measures the amount that futures currently trade above or below the cash VIX, (contango or backwardation) until front month future converges with the VIX at expiration.
For daily updates, follow our end-of-day volume weighted premium version located about half-way down the home page in the Options Data Analysis section on our website.
S&P 500 Index Technical Update

It should come as no surprise that the technical condition will look most discouraging to the bulls just before an oversold rebound – like now.
Although the 50 and 200-day moving averages add confusion to the picture they are important trend indicators and the SPX closed below the 200-day MA on Friday (red line above).
The second thing to notice is the potential double top defined by the first high made September 21 (9-21) and the second on May 1 (5-1), both marked DT. However, until it closes below the December 26 low at 2346.58 it remains a potential double top.
Next, there is a small Head & Shoulder Top starting with a left shoulder on March 21, and the right shoulder on May 16, marked LS and RS with a gray dotted Neckline, NL about 2800. The close at 2783.02 on May 29 activated this pattern with a measuring objective at 2646, marked MO with an arrow, determined by taking the height of the pattern measured from the high of the Head 2954.13 to the Neckline or 154 points, subtracted from the Neckline. (2800-154) = 2646. In addition, the pivot that formed the Right Shoulder could become Elliott Waves 1-2, presuming the downtrend continues; not labeled to minimize confusion.
Also, the upward sloping trendline from the December 26 low at 2346.58 that ended with the key reversal on May 1, is also not shown in order to keep the number of lines from becoming too confusing. However, the now operative downward sloping trendline, DSTL (see label in the right margin) from the May high 1, that currently crosses at just under 2840 above is shown. On any counter-trend rally this DSTL will likely provide resistance giving the bears with another place to hit the sell button.
Now oversold by most measures, a rebound is likely. Then, should it fail at the DSTL the next stop would likely be around the MO at 2646. Any further decline would renew calls for a retest of the December 26 low, one that several analysts had been expecting including Michael Burk, who claims if there are more than 250 new NYSE lows at the pivot, there will be a retest of the bottom. The new lows were 662 on December 26, unadjusted for the number of issues traded.
Strategy
Threats of new tariffs on imports from Mexico adds uncertainty to all the China trade rhetoric increasing risk and markets are responding.
"The word 'risk' derives from the early Italian risicare which means 'to dare.' In this sense, risk is a choice rather than a fate." – Peter Bernstein
Use any oversold counter-trend rally to add long position collars as well as put spreads to keep growing hedges.
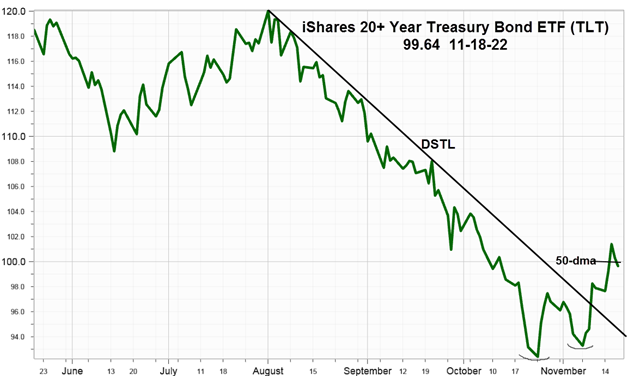
For nimble traders take a look at put spreads on iShares 20+ Treasury Bond ETF (TLT) 131.83 since it looks overbought and likely to pull back as SPX attempts a counter-trend bounce. With a potential Island Top Reversal consider a July 19 put spread, buying the July 19 130 put and selling the July 19 128 put. On Friday the debit was .68 at the close, but will likely be much different at the opening. Using spreads will offset implied volatility and time decay risk when option prices are high, and TLT implied volatility is near the top of its 52- week range at .85.
Summary
Along with threats of new tariffs on Mexican imports as well as increasing China trade and tariff rhetoric markets are responding to increased uncertainty pushing the US Dollar Index higher and interest rates lower along with equities. Although oversold and due for a counter-trend bounce, technical indicators suggest there is more downside ahead, including a possible retest of the December 26 low.
Comments
Log in or sign up to join the conversation.