
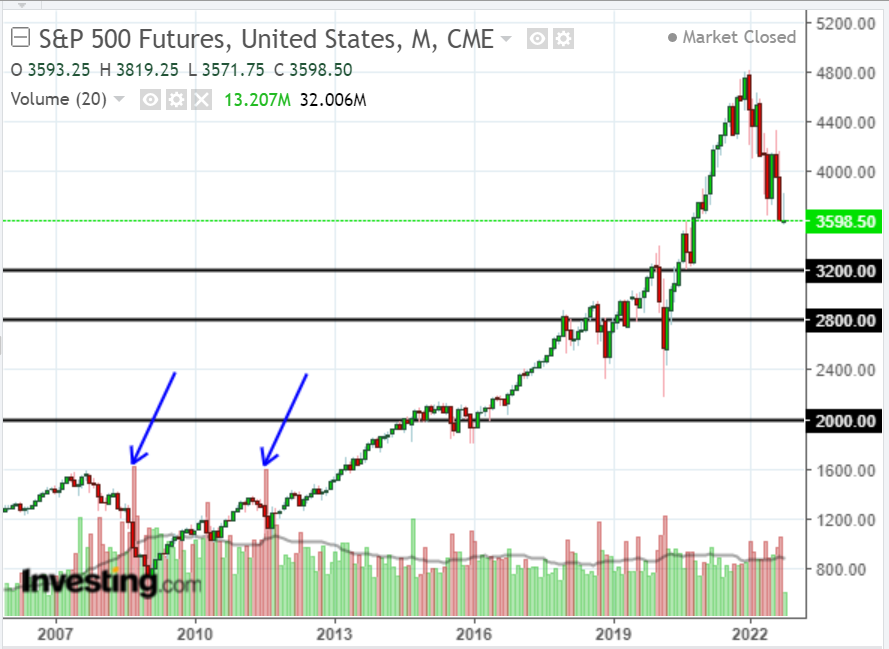
When we see an extreme volume spike form on the following monthly chart of the S&P 500 Futures Index (ES), it may be close to a bottom/capitulation, particularly if it falls near one of the major support levels, as shown.
Further bottoming clues are described, in detail, in my articles of October 2, September 30, and September 24, pertaining to the corresponding SPX and the SPX:VIX Ratio.
Until then, I expect volatility to continue, producing large intraday swings in both directions.
(Click on image to enlarge)
More By This Author:
Chart Of The Year: We(Didn't)Work
FedEx Volatility: Three Strikes And You're Out
Will The PHO ETF Sink Or Swim?


Comments
Log in or sign up to join the conversation.