

Tuesday Forecast
Uptrend scenario
The uptrend may be expected to continue, while the S&P 500 is trading above support level 3576, which will be followed by reaching resistance level 3666.
Downtrend scenario
A downtrend will start as soon, as the S&P 500 drops below support level 3576, which will be followed by moving down to support level 3521

This/Next Week Forecast (November 9 - 13, 2020)
Uptrend scenario
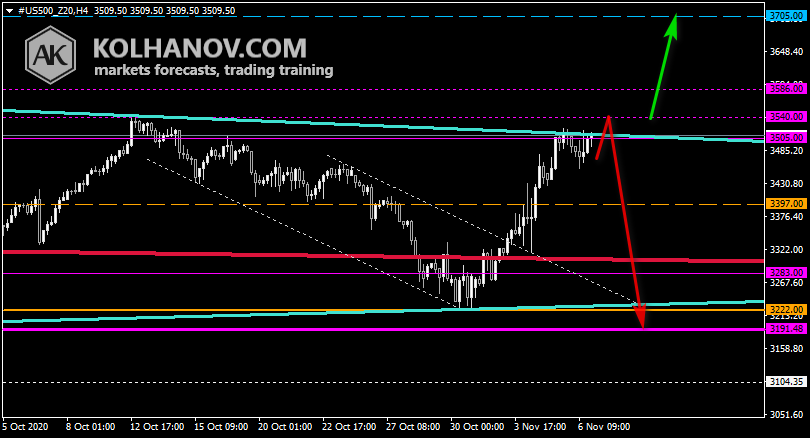
The uptrend may be expected to continue in case the S&P 500 rises above resistance level 1386, which will be followed by reaching resistance level 3705.
Downtrend scenario
A downtrend will start as soon, as the S&P 500 drops below support level 3505, which will be followed by moving down to support level 3222.

Previous week S&P 500 forecast chart
Fundamental Analysis
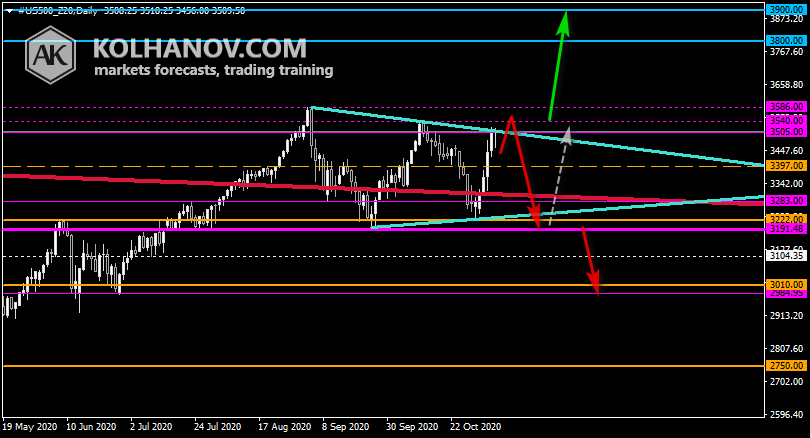
Economic recovery shows potential for an uptrend to the level 3900, but if due to the covid US will go to lockdown, the market can drop to 3000.

Monthly Forecast
Uptrend scenario
An uptrend will start as soon, as the S&P 500 rises above resistance level 3540, which will be followed by moving up to resistance level 3800 - 3900.
Downtrend scenario
The downtrend may be expected to continue, while the S&P 500 is trading below resistance level 3540, which will be followed by reaching support level 3191.


Comments
Log in or sign up to join the conversation.