

Thursday Forecast
Uptrend scenario
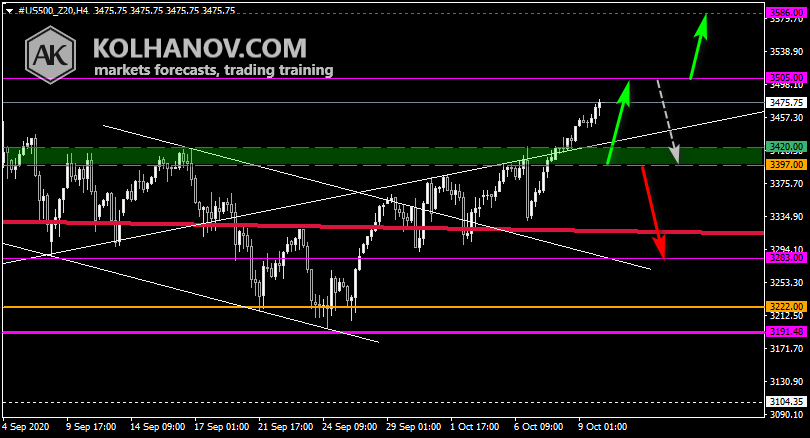
An uptrend will start as soon, as the S&P 500 rises above resistance level 3397, which will be followed by moving up to resistance level 3505 - 3540.
Downtrend scenario
A downtrend will start as soon, as the S&P 500 drops below support level 3397, which will be followed by moving down to support level 3283.

This/Next Week Forecast (October 19 - 23, 2020)
Uptrend scenario
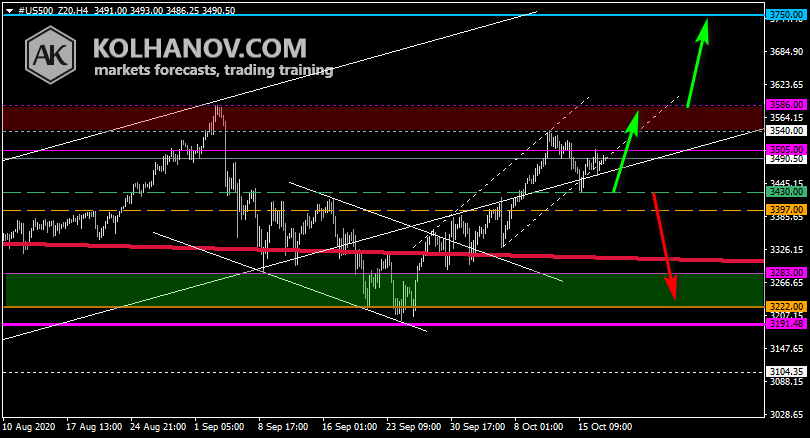
The uptrend may be expected to continue, while the S&P 500 is trading above support level 3430, which will be followed by reaching resistance level 3586 and if it keeps on moving up above that level, we may expect the S&P 500 to reach resistance level 3750.
Downtrend scenario
A downtrend will start as soon, as the S&P 500 drops below support level 3430, which will be followed by moving down to support level 3283 - 3222.
Previous week S&P 500 forecast chart
Fundamental Analysis
The slowdown in the labor and manufacturing sectors showing a fair price on the level 3000.

Long-Term Forecast
(Quarter III: July - September 2020)
Uptrend scenario
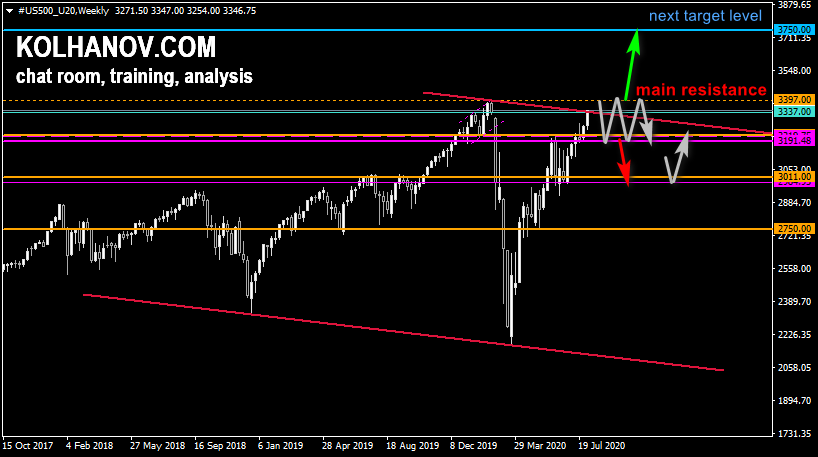
The uptrend may be expected to continue in case the S&P 500 rises above resistance level 3397, which will be followed by reaching resistance level 3750.
Downtrend scenario
A downtrend will start as soon, as the S&P 500 drops below support level 3191, which will be followed by moving down to support level 3011.


Comments
Log in or sign up to join the conversation.