

Image Source: Pexels
In this week's podcast, I discussed the current state of the market cycle, noting that Cycle 3 began in April 1949 and has been in motion for 77 years. I highlighted significant market events, including the Great Financial Collapse of 2008, and the decoupling of gold from the U.S. dollar in 1973. I emphasized that regardless of whether one counts this as a cycle, supercycle, or grand supercycle third wave, all point to the same endpoint for the long-awaited correction, which I estimates will reach around 667.
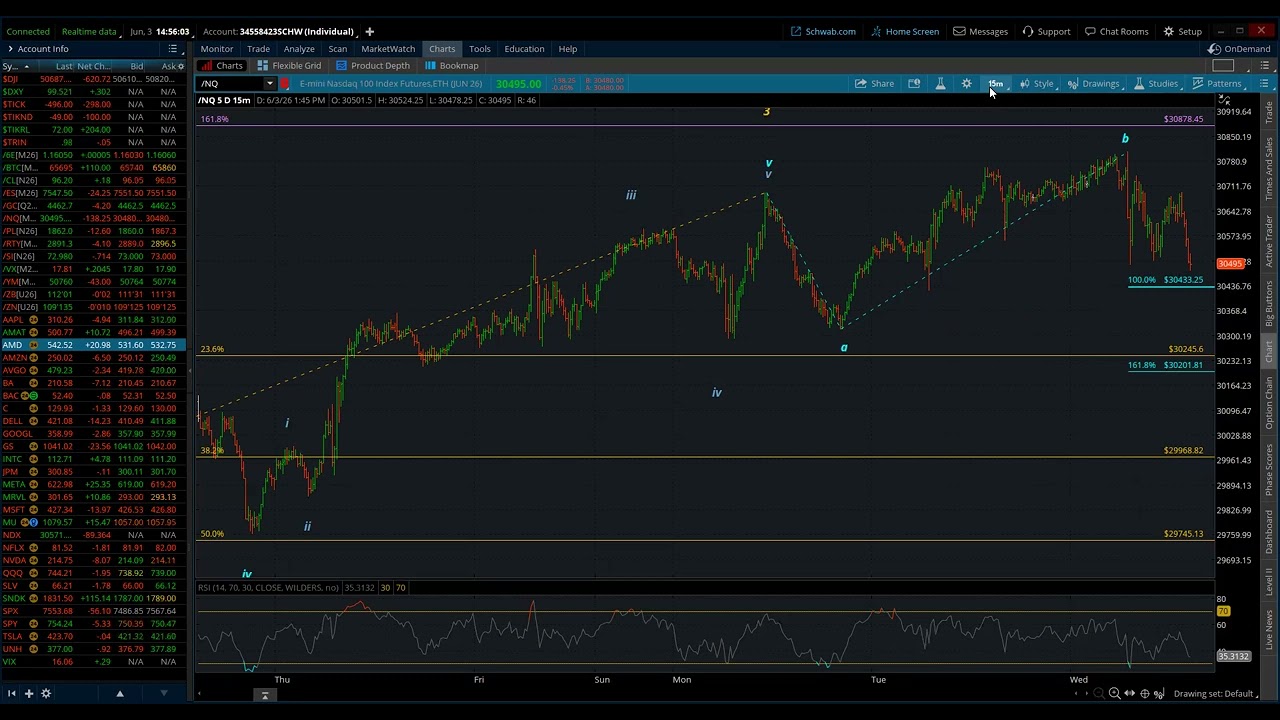
I discussed the analysis of market waves, focusing on a leading diagonal pattern and its implications for future market movements. I noted that wave 1 could be the longest in a leading diagonal, with wave 3 not being the shortest. I compared the cash and futures markets, observing that the cash market was cleaner. I adjusted the analysis, considering overlap in waves and potential corrections, but concluded that there was still upside potential in the market.
Video Length: 00:31:52
More By This Author:
Nasdaq 100 Elliott Wave Daily Update - Tuesday, Feb 3Nasdaq 100 Elliott Wave Weekly Update - Sunday, Feb. 1
Nasdaq 100 Elliott Wave Daily Update - Wednesday, Jan 28


Comments
Log in or sign up to join the conversation.