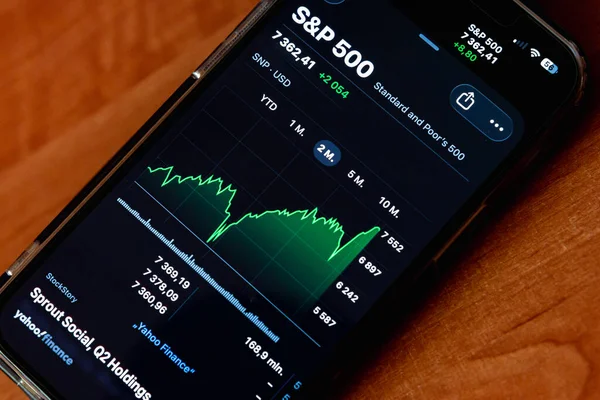
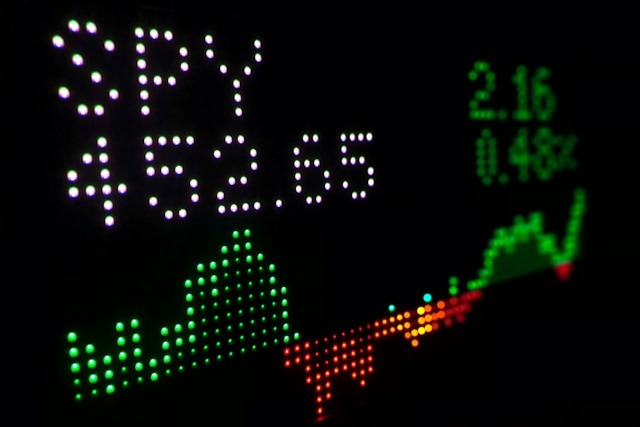
The S&P 500 (SPX) faces two Elliott Wave counts as technical indicators suggest a major market top may already be in place. Analyzing market math and dealer activity reveals whether a significant new downtrend has officially begun.
In this week's podcast I start with the cash SPX. I discussed narrowing down my count(s) and presented two main possibilities, with one being that the top is in and a new downtrend has begun. I emphasized focusing on the market math and Elliott Wave count rather than current geopolitical events, noting that dealer activity played a significant role in the market's movement.
Video Length: 01:09:52
Disclaimer:
Futures and Options trading has large potential rewards, but also large potential risk. You must be aware of the risks and be willing to accept them in order to invest in the futures and options markets. Don’t trade with money you can’t afford to lose. This is neither a solicitation nor an offer to Buy/Sell futures or options. No representation is being made that any account will or is likely to achieve profits or losses similar to those discussed on this web site. The past performance of any trading system or methodology is not necessarily indicative of future results.
CFTC Rule 4.41 – Hypothetical or simulated performance results have certain limitations. Unlike an actual performance record, simulated results do not represent actual trading. Also, since the trades have not been executed, the results may have under-or-over compensated for the impact, if any, of certain market factors, such as lack of liquidity. Simulated trading programs in general are also subject to the fact that they are designed with the benefit of hindsight. No representation is being made that any account will, or is likely to, achieve profit or losses similar to those shown.


Comments
Log in or sign up to join the conversation.