
The S&P 500 showed a bullish daily candle yesterday. This occurred after a Doji candle appeared at the previous bottom and 144 ema close.
This article why a bullish bounce is expected. But it will also review the potential for a larger ABCDE triangle (orange).
Price Charts and Technical Analysis
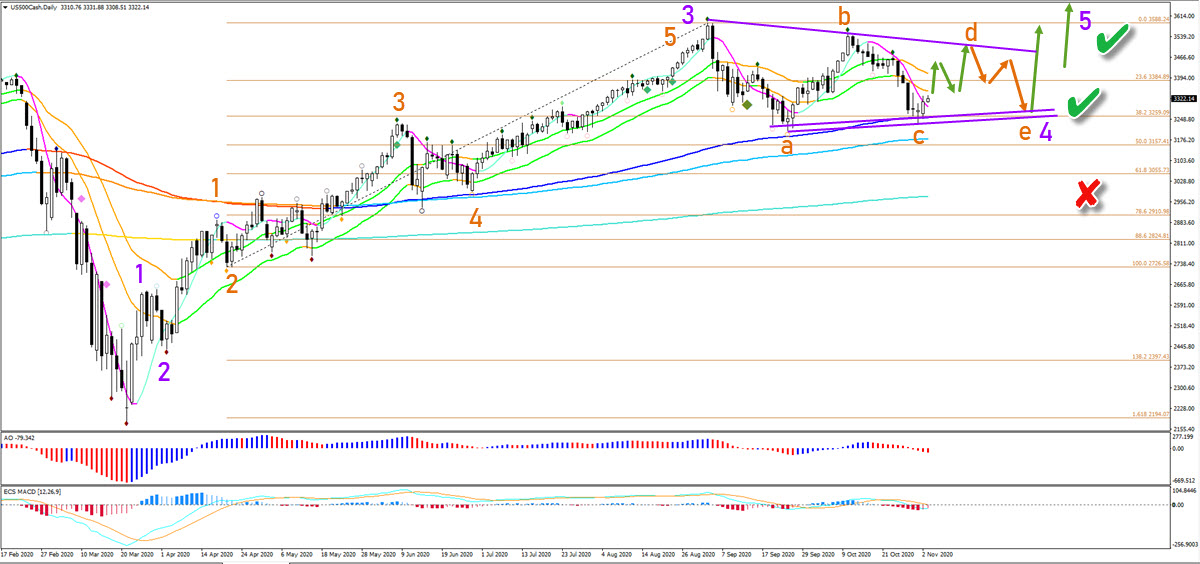
The S&P 500 is either completing an ABC or ABCDE. This depends on how price action responds to the resistance trend line. A bearish bounce confirms the wave D and E (orange).
The ABCDE could be a triangle pattern within a corrective wave 4 (purple). Price action completed a strong push up within wave 3 (purple). The wave 4 is only invalidated if price action remains above the 50% Fibonacci level.
The triangle pattern remains valid as long as the tops and bottoms are not broken. Once wave E is completed, price action is expected to bounce at support and break above resistance.
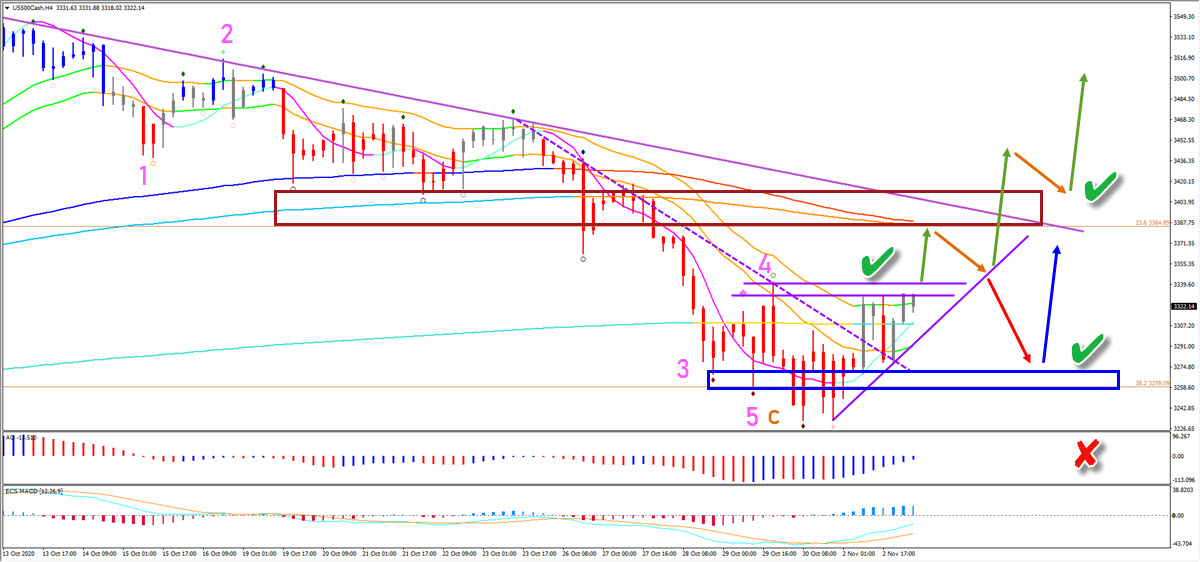
On the 4 hour chart, price action is testing the resistance (purple lines). Bullish breakouts could confirm (green checks) the uptrend whereas a break below the bottom invalidates the bullish bounce (red x).
The bullish breakouts would confirm the end of wave 5 (pink) and wave C (orange). A deeper retracement remains possible (red arrow) but the support zone (blue box) remains likely (blue arrow).


Comments
Log in or sign up to join the conversation.